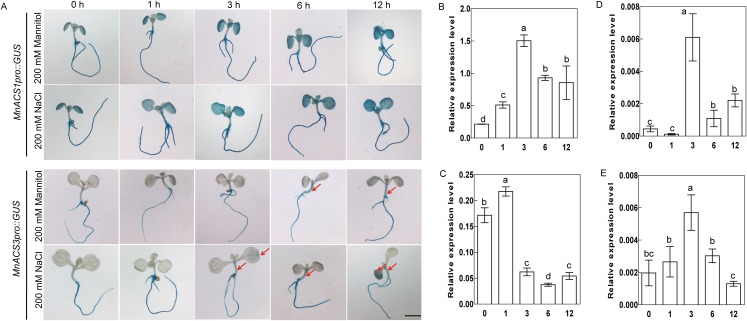
Figure 5. Analyses of promoter activities and expression levels of MnACS1 and MaACS3 genes in response to salt and drought treatments.
(A) Histochemical GUS staining of the MnACS1pro::GUS and MnACS3pro::GUS transgenic Arabidopsis under salt [200 mM NaCl] and drought (200 mM mannitol) treatments. Scale bar, two mm. (B) The expression level of MnACS1 in response to salt treatment. (C) The expression level of MnACS1 in response to drought treatment. (D) The expression level of MnACS3 in response to salt treatment. (E) The expression level of MnACS3 in response to drought treatment. Data are means ± SEs (n = 3). Means within a column with different letters are significantly different (P < 0.05). Means within a column with the same letters are not significantly different (P > 0.05).

