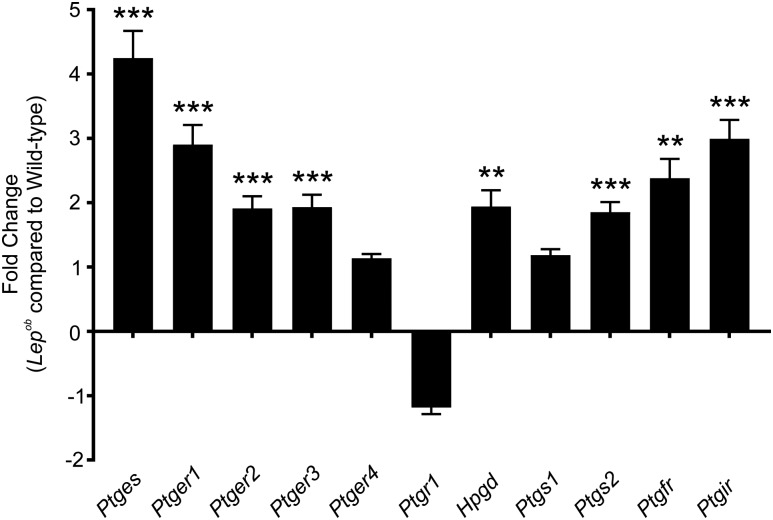
Figure 6.
qPCR comparing the expression of several key genes involved in prostaglandin synthesis and signaling in antrums from wild-type and Lepob mice. Bar graph depicts the fold change in prostaglandin-related gene transcripts. Several gene products were shown to be significantly upregulated in Lepob antrums compared with wild-type controls: terminal Ptges, Ptger1, Ptger2, Ptger3, Ptgs2, PGF receptor (Ptgfr), Ptgir, and Hpgd. Ptger4, Ptgr1, and Ptgs1 did not differ significantly in gene transcript expression between Lepob antrums and wild-type controls (unpaired Student t test). **P ≤ 0.01; ***P ≤ 0.001.

