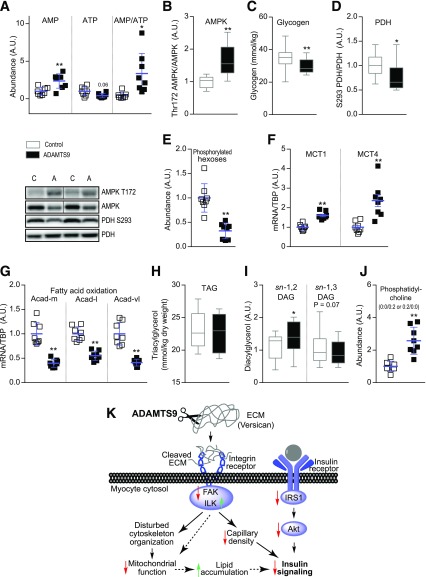
Figure 6.
ADAMTS9 overexpression alters the metabolic status of muscles. A, E, and J: Mouse TA muscles overexpressing ADAMTS9 or control plasmid were isolated at 10 weeks of age and used for metabolomic analysis (n = 8 for each group) as follows: AMP and ATP (A), phosphorylated hexoses (E), and phosphatidylcholine (0:0/0:2 or 0:2/0:0) (J). B and D: Western blot analyses (n = 12 for each group; results replicated twice and then pooled). C: Glycogen measurements (n = 16 for each group). F and G: mRNA expression normalized to TBP (n = 8 for each group). H: Intramuscular TAG analysis (n = 12 for each group). I: DAG isomers sn-1,2 and sn-1,3 (n = 12 for each group, except for n = 11 for control sn-1,2 DAG). Statistical significance was determined using paired Student t test. Scatter plot data are mean ± SD. *P < 0.05, **P < 0.01 for effect of ADAMTS9 overexpression vs. control plasmid. Dividing lines have been used in some representative plots. K: Proposed mechanism for how high ADAMTS9 expression induces insulin resistance. See Discussion for details. A.U., arbitrary units.

