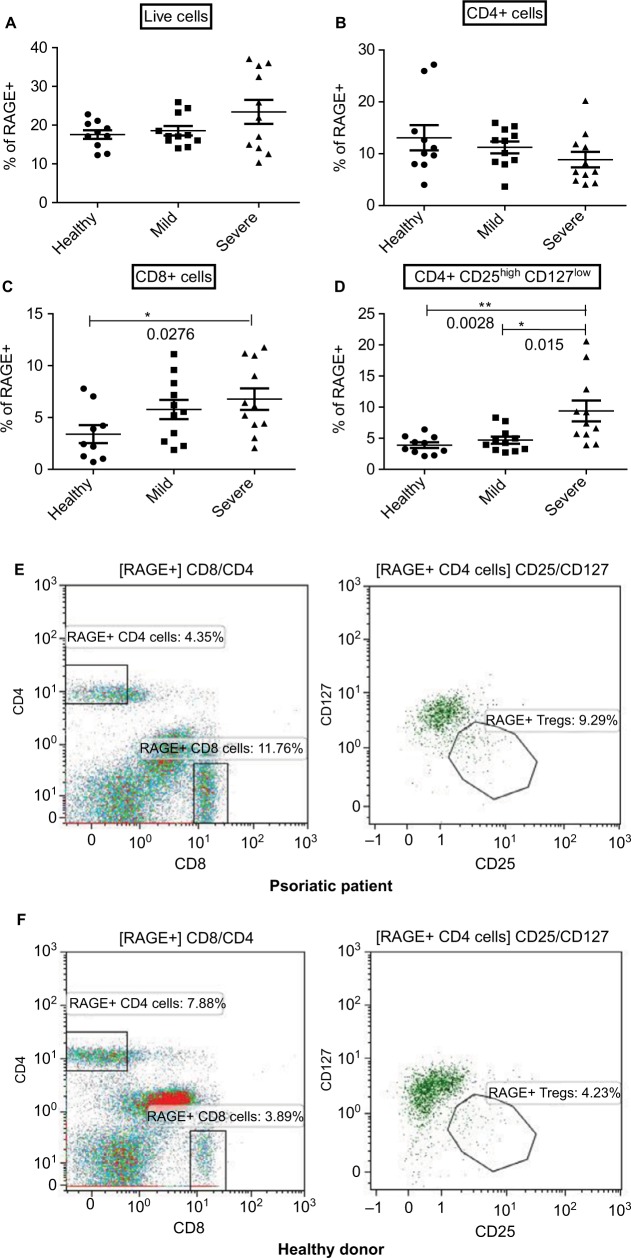
Figure 3.
Expression of RAGE on the surface of CD8+ and CD4+ T cells as well as CD4+ regulatory T cells correlates with disease severity.
Notes: Flow cytometry of RAGE expression on all live immune cells (A), CD8+ T Cells (B), CD4+ T Cells (C), and CD4+ Treg (D) of healthy controls (n=10) and patients with mild (n=11) and severe (n=11) psoriasis vulgaris. Representative flow plots are displayed for RAGE+ Tregs in patients (E) and controls (F). RAGE expressions in individual patients as well as arithmetic means are shown. *P<0.05, **P<0.01, Mann–Whitney U test.

