. 2018 Dec 26;10(8):2253–2258. doi: 10.1039/c8sc03614d

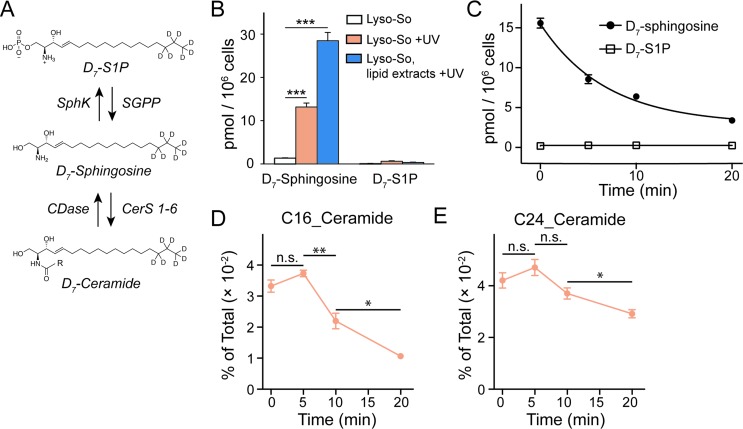
Fig. 3. Sphingolipid analysis of lysosome-targeted caged sphingosine. (A) Schematic illustration of the interconversion between sphingosine, sphingosine 1-phosphate (S1P) and ceramides. Sphingosine can be phosphorylated into S1P by sphingosine kinases (SphKs); and S1P can be dephosphorylated into sphingosine by sphingosine 1-phosphate phosphatases (SGPPs). Ceramide synthases (CerS 1–6) convert sphingosine into ceramides with various acyl chain lengths; ceramidases (CDases) cleave ceramides to yield sphingosine and fatty acids. (B) Analysis of D7-sphingosine and D7-S1P levels under various experimental conditions as indicated. (C) Changes of sphingosine and S1P levels over time after uncaging of D7-Lyso-So in HeLa cells. The decay curves were generated by fitting into a single phase decay function. Data in (B) and (C) were normalized with respect to the amount of C17 internal standards and cell numbers. (D and E) Metabolism of newly formed D7-ceramides after photo-releasing D7-sphingosine from Lyso-So in HeLa cells. Data in (D) and (E) were normalized by the sum of all measured lipid signals and presented as “mol% of total”. All data represent the average of three independent experiments. Error bars represent SEM. *p < 0.05, **p < 0.01, ***p < 0.001, n.s., not significant, Students' t-test.

Fig. 3