. 2018 Dec 26;10(8):2253–2258. doi: 10.1039/c8sc03614d

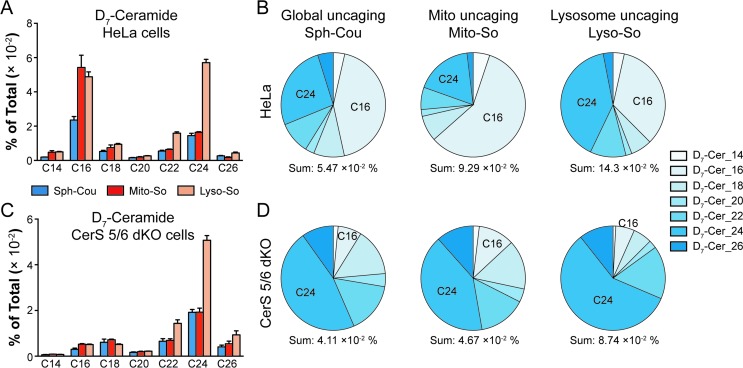
Fig. 4. Comparison of newly formed ceramides in wild-type (WT) and CerS 5/6 dKO cells after photoactivation. Cells were treated with caged probes (2 μM), uncaged for 2 minutes, and incubated for 5 minutes prior to lipid extraction. (A and B) Analysis of D7-ceramides in HeLa WT cells after releasing sphingosine from different sources as indicated. (C and D) Analysis of D7-ceramides in CerS 5/6 dKO cells after releasing sphingosine from different sources as indicated. Pie charts were generated from the average values of ceramide with different acyl chains, respectively. Data were normalized by measured total lipid signals and presented as “mol% of total”. The sum indicates the summation of D7-ceramides (% of total) of different acyl chains. Data represent the average of three independent experiments. Error bars represent SEM.

Fig. 4