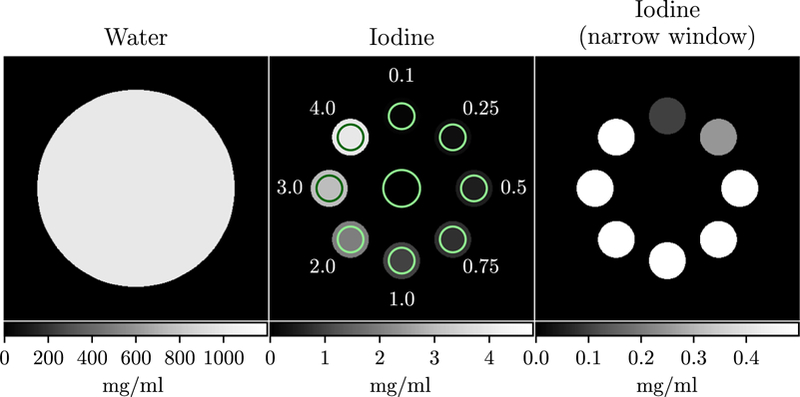
Figure 1.

Iodine sensitivity phantom. The numbers indicate the iodine concentration in each adjacent region of interest (ROI) in mg ml-1. ROI specific contrast-to-noise ratio (CNR) was calculated as the ratio of the mean in the regions indicated by the circles along the edge of the phantom to the standard deviation in the inner circle.
