Figure 7.

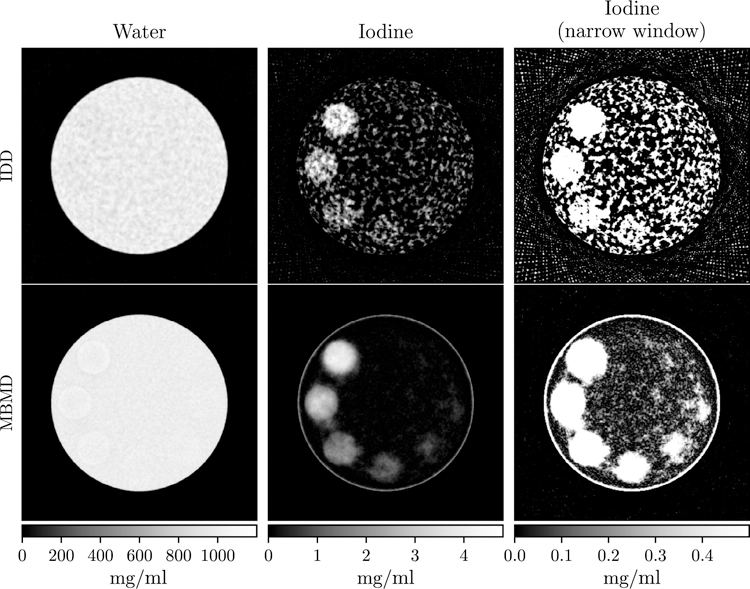
IDD (top) and MBMD (bottom) reconstructions of water (left) and iodine (middle and right) concentrations. The right column is the same as the center but with a tighter window to better visualize the low concentration ROIs.

IDD (top) and MBMD (bottom) reconstructions of water (left) and iodine (middle and right) concentrations. The right column is the same as the center but with a tighter window to better visualize the low concentration ROIs.