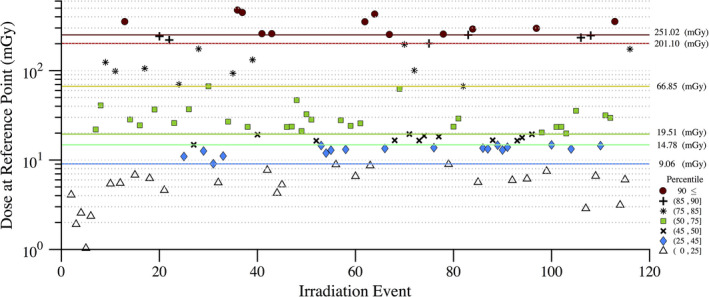
Figure 11.

Disparity in dose (mGy) at the reference point for each irradiation event of RDSR No. 1124. Patient underwent a bilateral uterine artery embolization. The corresponding dose at the reference point for each irradiation event is color coded to illustrate how that irradiation event compares to other events within the procedure. The horizontal lines reflect the 90, 85, 75, 50, 45, and 25th percentile cutoffs. [Color figure can be viewed at wileyonlinelibrary.com]
