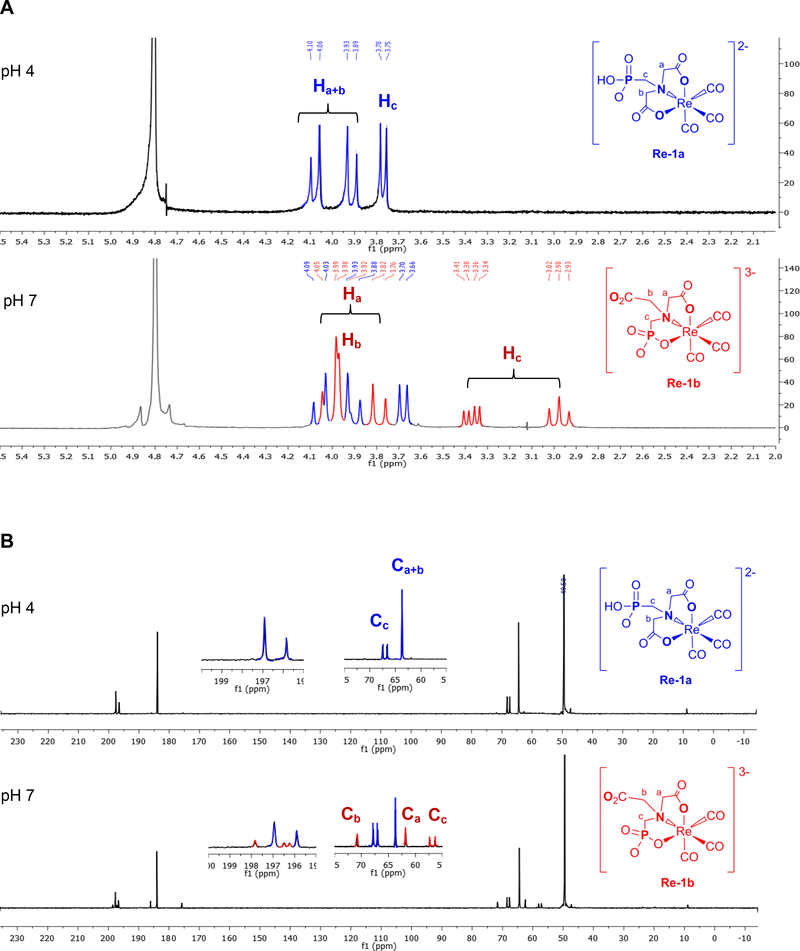
Figure 2.
(A) 1H NMR spectra in D2O of [Re-1a]2− at pH 4 (top) and a mixture of [Re-1a]3− and [Re-1b]3− at pH 7 (bottom). (B) 13C NMR (B) spectra in D2O of [Re-1a]2− at pH 4 (top) and a mixture of [Re-1a]3− and [Re-1b]3− at pH 7 (bottom). Selected signals from the symmetrical isomer [Re-1a]2− (blue) and the unsymmetrical isomer [Re-1b]3− (red) are labeled to highlight significant differences for both 1H NMR and 13C NMR spectra.

