
Figure 1. GABAergic neurons surround and contact LC noradrenergic neurons.
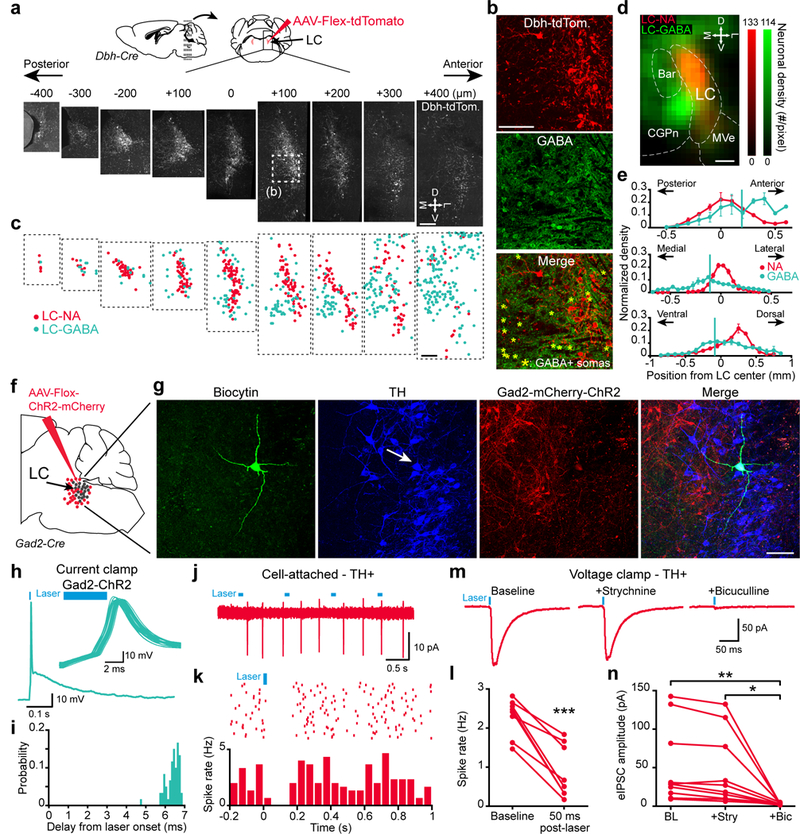
a. Dbh-Cre mice were injected with AAV-Flex-tdTomato virus in the LC and coronal sections were collected. Boxed area (at +100 um location) is shown magnified in (b). M: medial, D: dorsal, L: lateral; V: ventral. b. Location of GABA expressing somata were revealed by immunohistochemistry. c. LC-NA and LC-GABA soma locations derived from (a) and (b). d. Map of LC-GABA and LC-NA neuronal density in a radius of 200 μm around the LC region. The map is projected onto an antero-posterior axis. Bar: Barrington’s nucleus; MVe: medial vestibular nucleus; CGPn: central gray of the pons. e. Distribution of LC-GABA and LC-NA neurons in the 3 axes. Vertical green lines represent the center of the distribution for the GABA+ population. Data are presented as mean ± s.e.m. N = 3 mice used for (a-e). f. Methods for infecting LC-GABA neurons with mCherry/ChR2. g. Example of a LC neuron filled with biocytin during whole cell recordings that expresses tyrosine hydroxylase (TH; arrow). Repeated for 8 LC neurons. h. Current-clamp recording of a Gad2-mCherry expressing neuron. Inset - overlay of multiple trials of the same cell following light activation. i. Distribution of spike delays from light onset of the cell shown in (h). j-k. Example traces from the LC-TH+ neurons displayed in (g). j. Cell-attached recordings during light activation of Gad2 neurons. k. Raster plot and post-stimulus time histogram aligned to light activation. l. Effect of light activation on spike rates for all TH+ neurons recorded (n = 8 neurons from 3 mice, ***: p = 0.00015, two-tailed paired t-test, t7 = −6.5869). m. Trial average (n = 60 trials) IPSCs recorded in voltage-clamp following light activation and the application of strychnine and bicuculline. n. Light-evoked IPSC amplitudes following application of strychnine and bicuculline (n = 10 neurons from 4 mice, one-way repeated measured ANOVA, F2,9 = 8.601, **: p = 0.0034, *: p = 0.0102 using Tukey post-hoc test). Blue bars in (h, j-l) indicate the timing of blue light activation. Scale bars: (a), (c), and (d): 200 μm; (b) and (g): 100 μm;