
Figure 5.
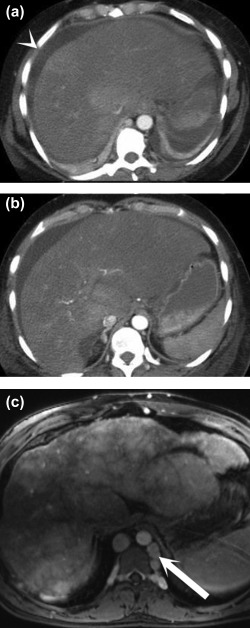
Acute versus chronic Budd‐Chiari syndrome. Postcontrast axial CT images (A and B) show a large, heterogeneous liver, ascites (arrowhead), and nonvisualization of the hepatic veins. Postcontrast T1‐weighted MR image (C) demonstrates the classic “nutmeg” appearance of the parenchyma, surface nodularity (a sign of atrophy), and collateral formation (arrow).