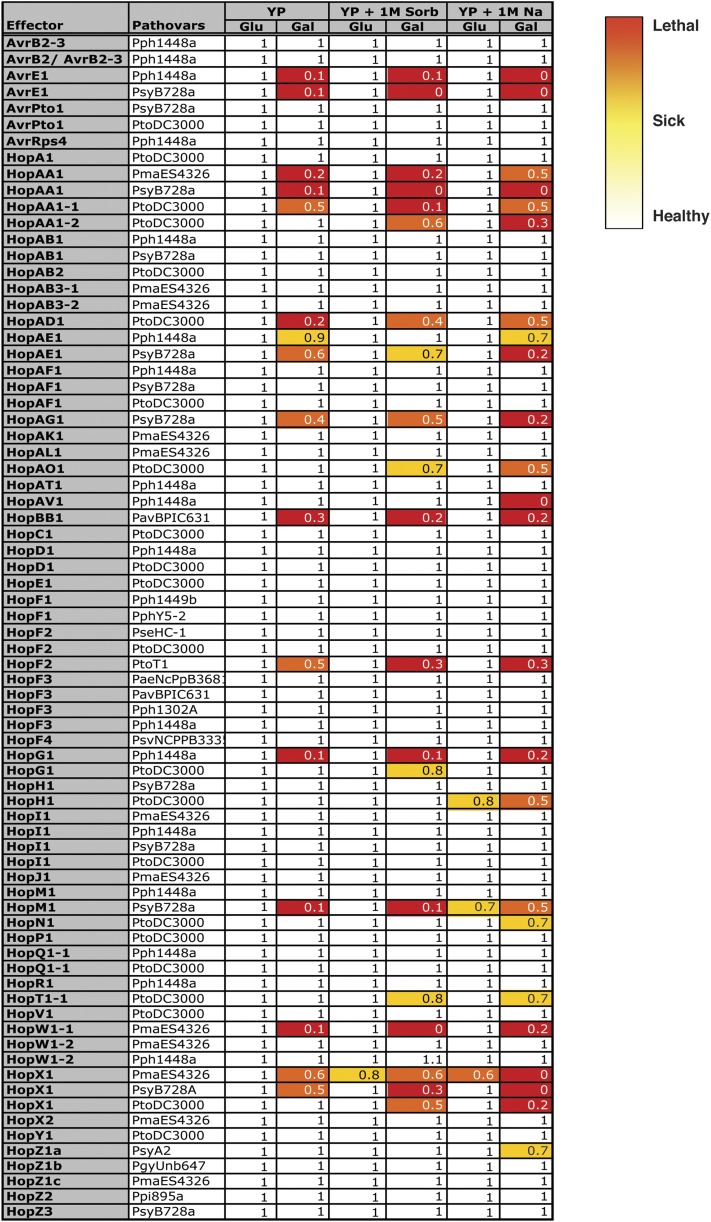
Figure 1.
Growth inhibition profiles of yeast (Y7092) expressing 75 P. syringae T3SEs on rich media (Hong et al.), rich media with 1 M sorbitol (YP + 1M Sorb), and rich media with 1 M NaCl (YP + 1M Na). The growth inhibition by each T3SE in each condition is represented in numbers and heat map, with 1 (or white) corresponding to no growth inhibition to 0 (or red) corresponding to complete growth inhibition. The fitness numbers are calculated for every condition (Glu = glucose and T3SE-repressing, Gal = galactose and T3SE-expressing) by normalizing the fitness of yeast expressing T3SE to the negative control strain containing the integrated NATR antibiotic cassette at the ho locus.

