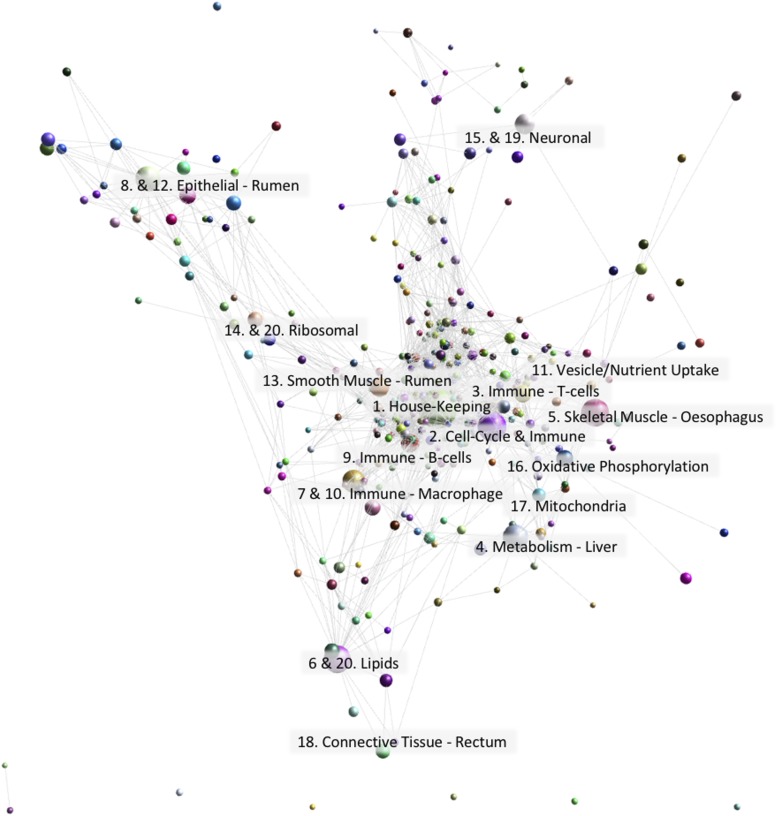
Figure 2.
Gene-to-gene network graph of sheep GI tract tissues alongside alveolar macrophages, esophageal tissue and liver with the nodes collapsed by class to illustrate the relative size of each cluster. The top 20 largest clusters are annotated by function. Created using Graphia Professional with parameters Pearson’s R = 0.85, MCLi = 2.2, Minimum Component Size = 2, Minimum Cluster Size = 2.

