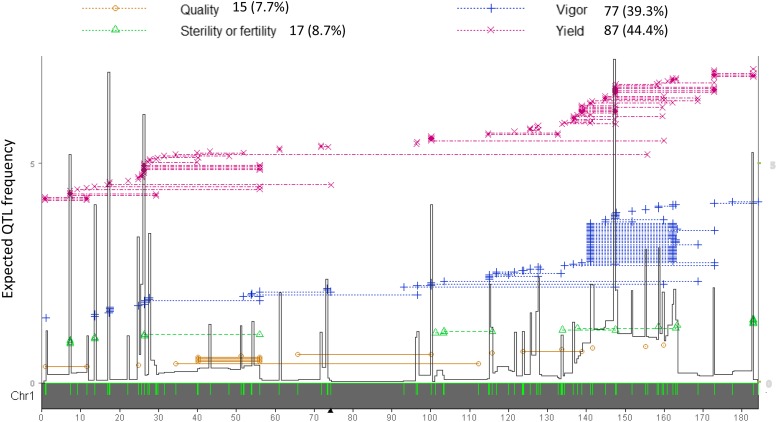
Figure 2.
An illustration of the QTL data structure and the uniform method of computing the expected QTL frequency (EQF) in hotspot detection. The 196 QTL in the rice 1st chromosome from Gramene Rice database (http://www.gramene.org/) are used for illustration. The green ticks on the x-axis denote the positions of the 163 markers. The dotted lines denote the lengths of the marker intervals flanking the QTL responsible for yield, vigor, sterility and quality traits (denoted as ×, +, ∆ and ○, respectively). The EQF architecture (the black line) are constructed by the uniform method with bin size of 0.5 cM. The black lines on the right and left borders represent the EQF. ▲denotes the position of centromere.

