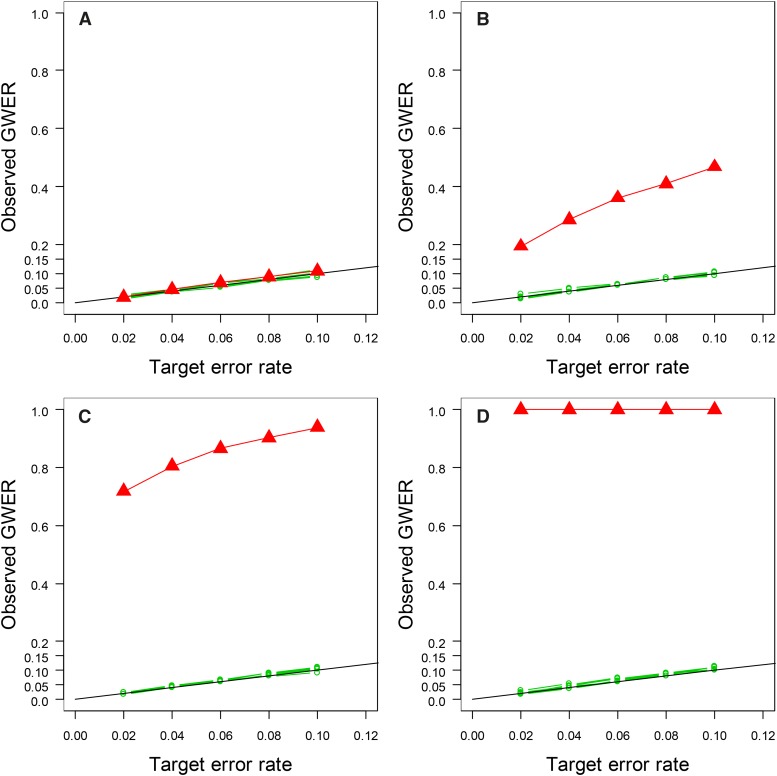
Figure 4.
Observed GWERs for the qFreq(n), n = 1,2, ..., 10, statistics of the proposed statistical procedure and for the Q-method at the α =0.02, 0.04, 0.06, 0.08 and 0.10 levels under varying strengths of QTL correlation: (A) uncorrelated, (B) weakly correlated, (C) moderately correlated, and (D) highly correlated, respectively. Black lines show the targeted error rates. Red lines show the observed GWERs of the Q-method. Green lines show the observed GWERs of the qFreq(n), n = 1,2, ..., 10, statistics.

