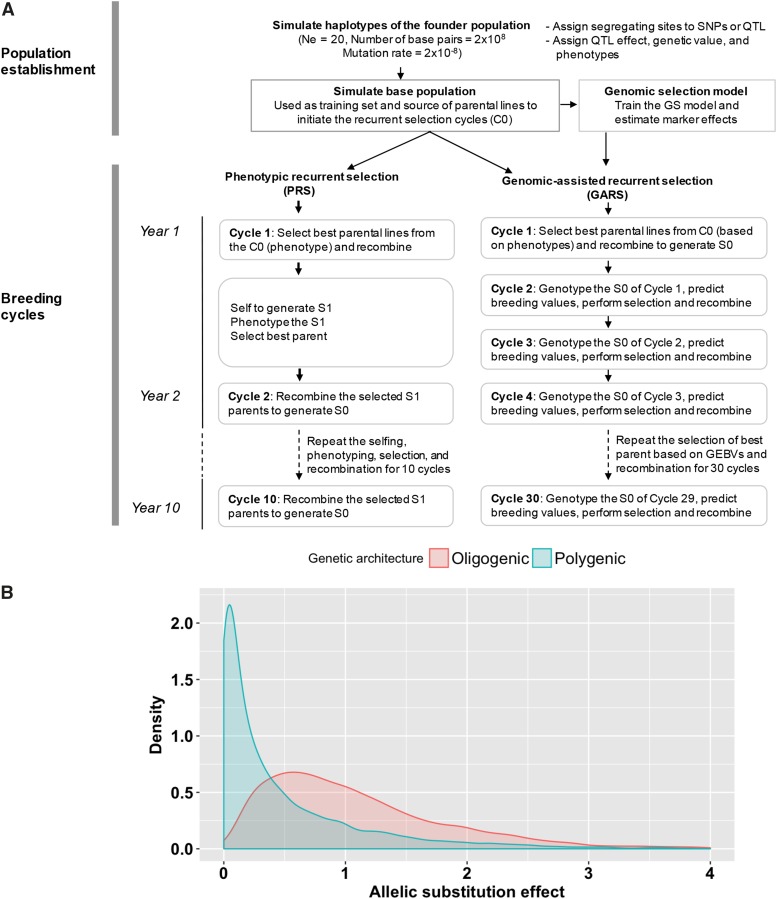
Figure 1.
Breeding program simulation. (A) Schematic representation of the simulated breeding programs. In the population establishment phase, the base population was created by randomly intercrossing the founder population for several generations, which was then phenotyped and genotyped to be used as a training population. For the breeding cycles, the training population was used as a cycle 0 generation from where best parents were selected to initiate PRS and GARS. GARS was conducted three cycles per year (GARS3, shown) or two cycles per year (GARS2, not shown), compared to a single cycle of PRS per year. (B) The density plot of the distribution of allelic substitution effects of the quantitative trait loci (QTL) simulated in two trait genetic architectures (oligogenic and polygenic architectures).

