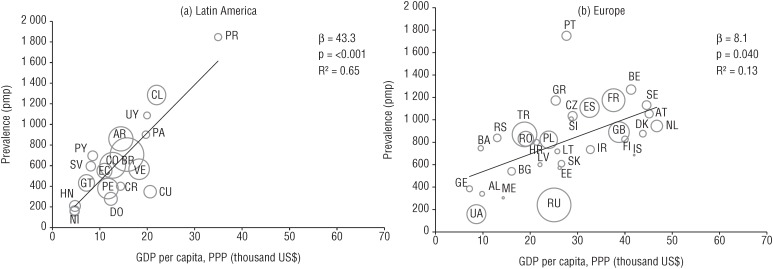
FIGURE 3. Association between gross domestic product (GDP) per capita and prevalence of renal replacement therapy (RRT) per million population (pmp), in Latin America (A) and Europe (B)a.
a The weighted regression line in this bubble plot displays the univariate association between gross domestic product (GDP) per capita (based on purchasing power parity (PPP) expressed in US dollars) and the RRT prevalence. The size of marker denotes the size of the general population under study. The country abbreviations used are: AL, Albania; AR, Argentina; AT, Austria; BA, Bosnia and Herzegovina; BE, Belgium; BG, Bulgaria; BO, Bolivia; BR, Brazil; CH, Switzerland; CL, Chile; CO, Colombia; CR, Costa Rica; CU, Cuba; CZ, Czech Republic; DK, Denmark; DO, Dominican Republic; EC, Ecuador; EE, Estonia; ES, Spain (18 of 19 regions); FI, Finland; FR, France; GE, Georgia; GR, Greece; GT, Guatemala; HN, Honduras; HR, Croatia; IL, Israel; IS, Iceland; LT, Lithuania; LV, Latvia; ME, Montenegro; NI, Nicaragua; NL, the Netherlands; NO, Norway; PA, Panama; PE, Peru; PL, Poland; PR, Puerto Rico; PT, Portugal; PY, Paraguay; RO, Romania; RS, Serbia; RU, Russia; SE, Sweden; SI, Slovenia; SK, Slovakia; SV, El Salvador; TR, Turkey; UA, Ukraine; UK, United Kingdom; UY, Uruguay; VE, Venezuela.
Source: Prepared by the authors, using study data.

