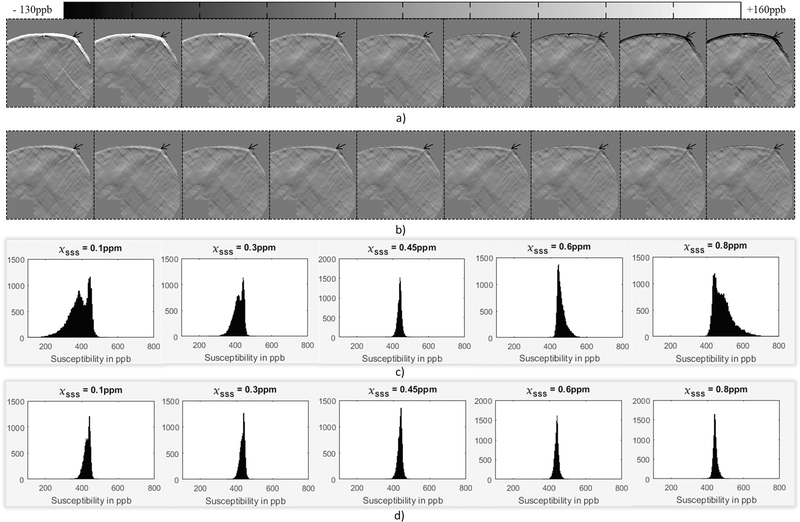
Figure 3.
Difference maps from the ground truth produced by subtracting the FIT-SWIM results before (a) and after (b) applying AS-SWIM. From left to right, the images in (a) and (b) represent different initial assumptions for ΔχSSS (in ppm) as: 0.1, 0.2, 0.3, 0.4, 0.45, 0.5, 0.6, 0.7 and 0.8. The actual value assigned to SSS in all cases was 0.45ppm. The error, identified by the region around the black arrows, is more substantial for the extended-SWIM result and for the FIT-SWIM process without any correction. These plots demonstrate that before correction (c), the variation in the Δχ distribution inside the dural sinuses was dependent on the initial value, whereas after the AS correction (c) the Δχ distribution was consistent independent of the initial

