Fig. 3.

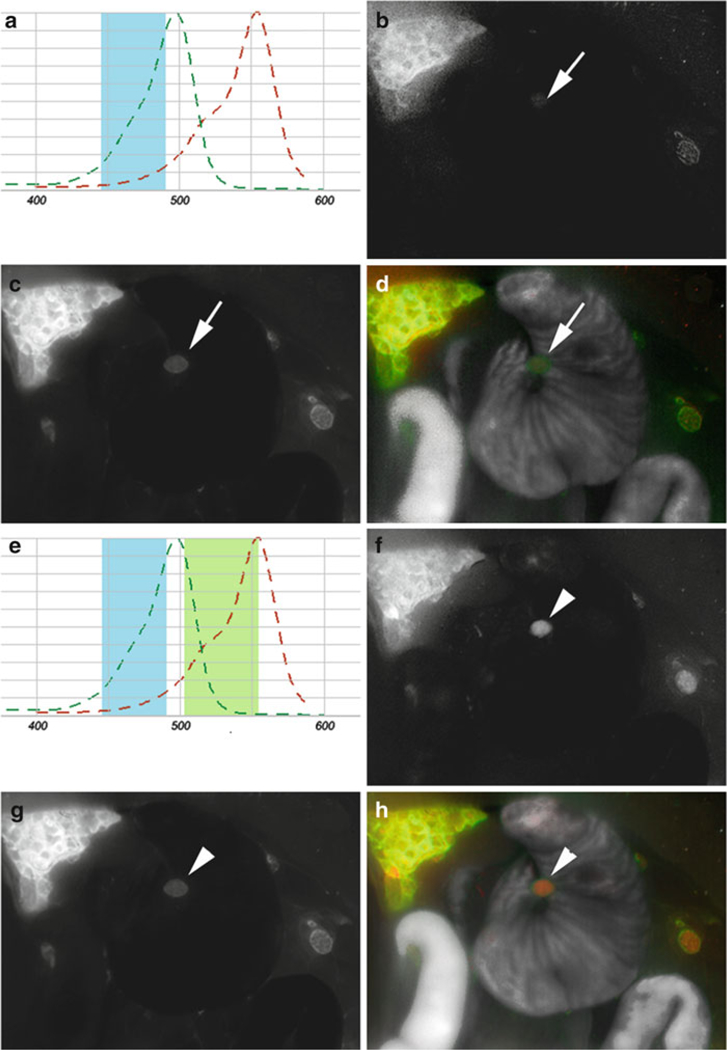
Comparison of single- and multi-excitation in a peritoneal-dissemination model of ovarian cancer. (a) Schematic of RFP (red) and RhodG (green) absorbance curves, and range of single blue excitation light (blue). The blue light adequately excites RhodG, but only suboptimally excites RFP. (b-d) Spectral fluorescence images taken with a single excitation blue light using a co-staining method in a SHIN3-RFP-tumor-bearing mouse receiving GmSA-RhodG. (b) RFP spectrum identifies endogenous expression of RFP by SHIN3 cells but is unable to recognize tumor nodules (arrowS) that are visible on the RhodG spectrum (c). (d) Two-color overlay using single excitation light. (e) Schematic of multi-excitation (blue and green) light on the absorbance curves of RFP (red) and RhodG (green) demonstrating more efficient excitation of RFP by green light. (f-h) Spectral-fluorescence images, taken with multiple-excitation filters in the same mouse, demonstrates the ability to identify the previously-invisible tumor nodules on the RFP spectrum (f, arrowhead) that are still present on the RhodG spectrum (g). (h) Two-color overlay using multiple excitation filters.
