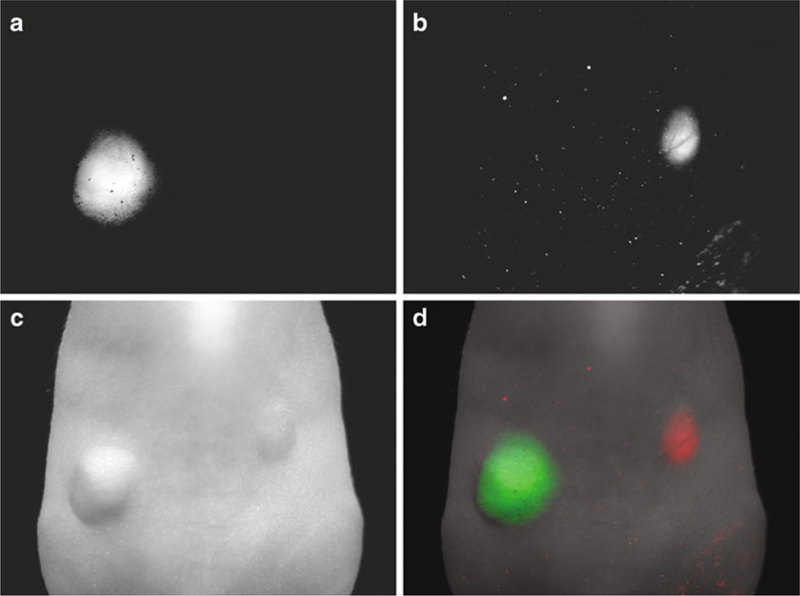
Fig. 4.

Subcutaneous-xenograft model identified with counter-staining. Spectral-fluorescence images of a mouse bearing ATAC4 (IL-2Rα+) and A431-RFP (IL-2Rα-) tumors receiving ICG-conjugated daclizumab (anti-IL-2Rα). Unmixed spectral fluorescence images illustrate (a) the ICG spectrum demonstrating the localization of ATAC4 tumors labeled with ICG conjugated daclizumab, (b) the RFP spectrum localizing A431 cells endogenously expressing RFP. (c) White light image, and (d) two-color overlay demonstrates that ATAC4 tumor (IL-2Rα+) is depicted only in the ICG spectrum (green), while a A431-RFP tumor is depicted only in the RFP spectrum (red) and does not show any fluorescence in ICG spectrum.
