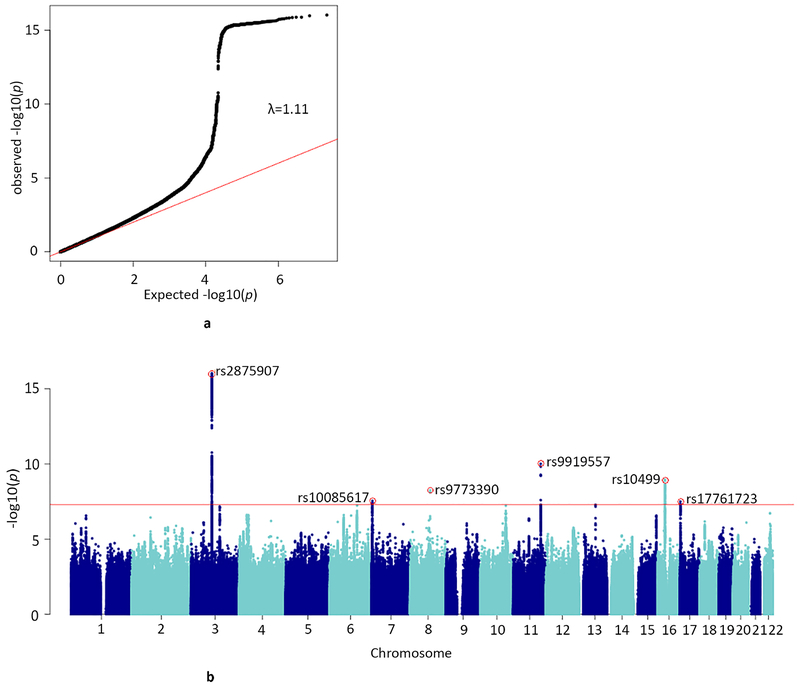
Figure 1.
a) QQ-plot of the distribution of the −log 10(p-values) observed for the SNP associations with lifetime cannabis use against those expected under the null hypothesis
Expected −log 10(p-values) under the null hypothesis are indicated by the red line. Genomic inflation is indicated with λ in the plot. There was no evidence for population stratification (LD score regression b0=1.00, SE=0.007).
b) Manhattan plot for the SNP-based GWAS meta-analysis
Results are based on N=184,764 individuals and NSNPs=11,733,371 SNPs. The SNP with the lowest p-value per independent (R2<0.1, window size 250 kb) genome-wide significant locus is annotated (red circle with rs-number). The red line represents the conventional genome-wide significance threshold of p<5e-08. The statistical test comprised linear regression; significance was tested two-sided.

