
Figure 2. Regional plots of the genome-wide significant SNPs.
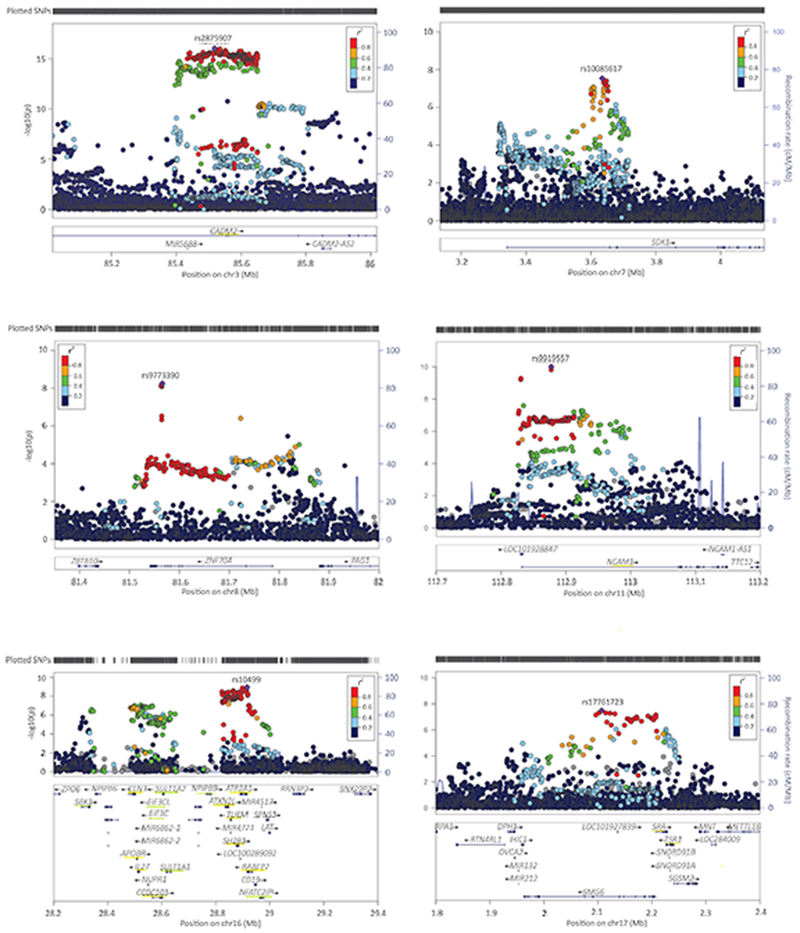
Underlined in yellow are the genes that were significant in the gene-based test (tested two-sided; p<2.74e-06, Bonferroni corrected p-value threshold of p<0.05 adjusted for 18,293 tests); underlined in green the genes that were identified in the S-PrediXcan analysis only (p<1.92e-07, Bonferroni corrected p-value threshold of p<0.05 adjusted for 259,825 tests). Colors of the dots indicate the level of LD (blue for low and red for high LD) with the lead SNP (purple; independent defined as R2<0.1, window size 250 kb).