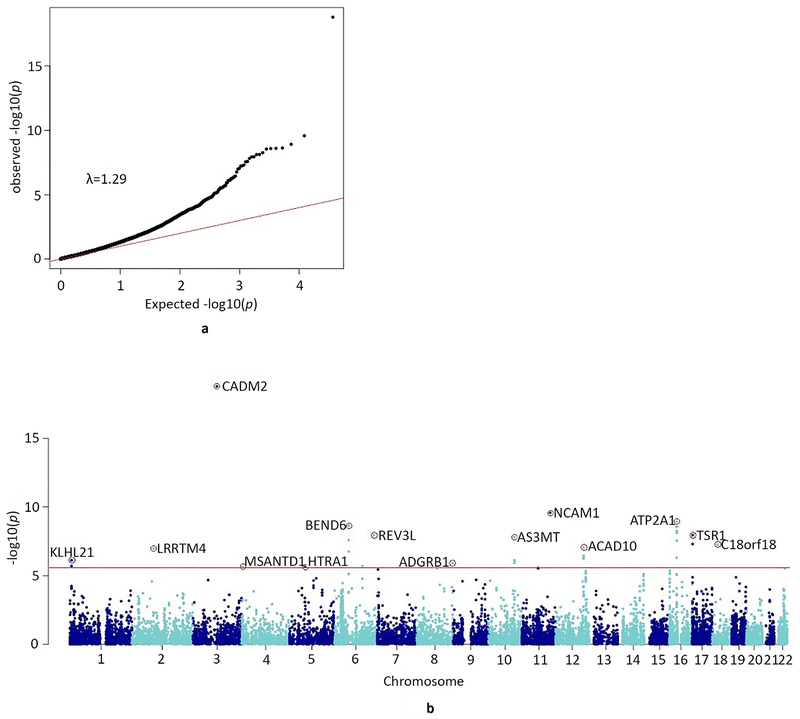
Figure 3.
a) QQ-plot of the distribution of the −log10(p-values) for the gene-based association with lifetime cannabis use against those expected under the null hypothesis
Expected −log 10(p-values) under the null hypothesis are indicated by the red line. Genomic inflation is indicated with λ. The gene-based test was performed in MAGMA, which uses multiple regression (tested two-sided).
b) Manhattan plot for the gene-based test of association
The red line represents the genome-wide significance threshold of p<2.74e-06, (Bonferroni corrected p-value threshold of p<0.05 adjusted for 18,293 tests; NSNPs=5,710,956 were mapped to at least one gene). The top-gene (with the lowest p-value) per locus is annotated (red circle with gene symbol).

