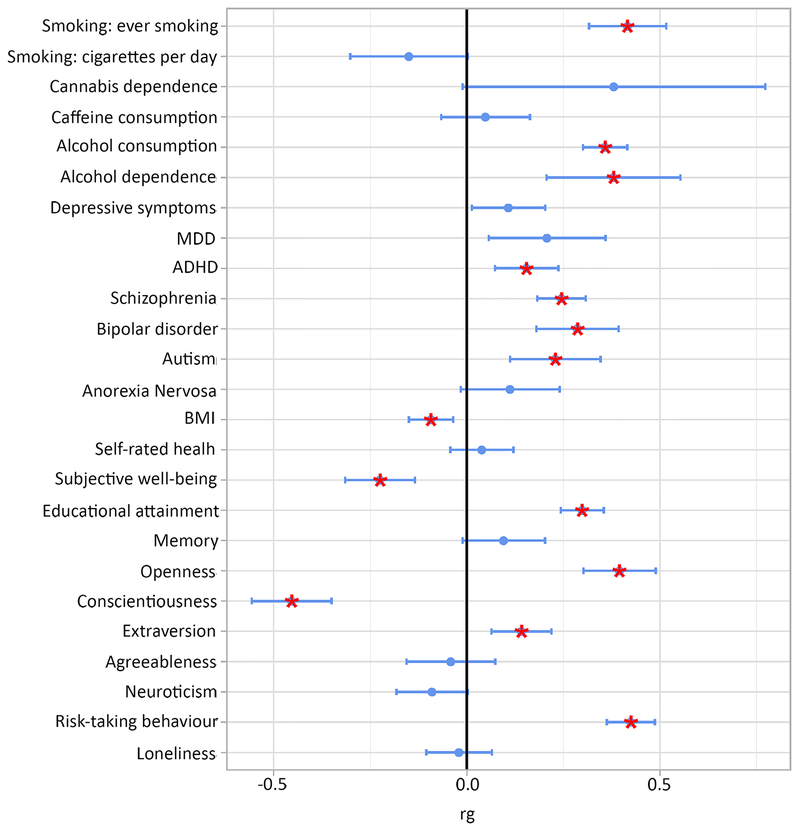
Figure 4. Genetic overlap between lifetime cannabis use and other phenotypes.
Blue dots represent point estimates of the genetic correlation, blue error bars represent 95% confidence intervals and red asterisks indicate significant associations after correction for multiple testing (two-sided p<0.002, Bonferroni corrected p-value threshold of p<0.05 adjusted for 25 tests).
MDD=Major Depressive Disorder; ADHD=Attention Deficit Hyperactivity Disorder; BMI=Body Mass Index

