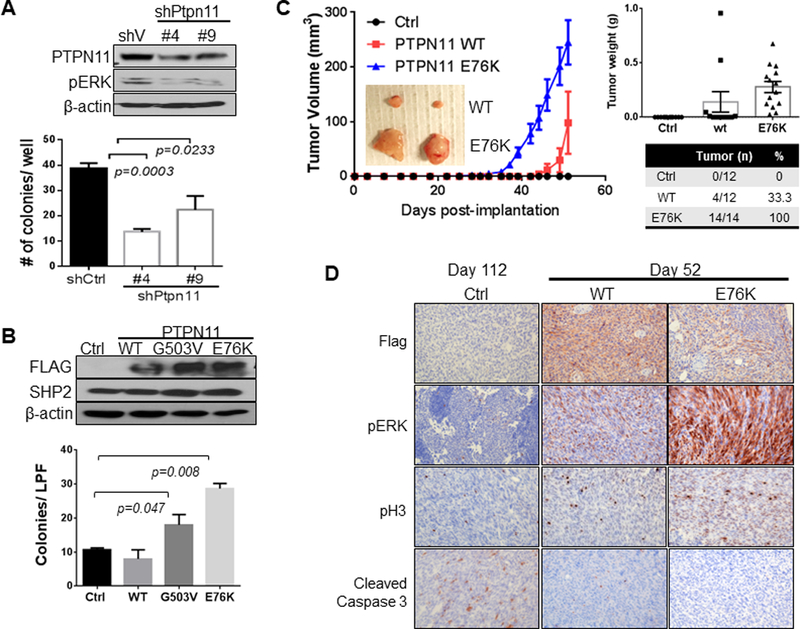
Figure 3. PTPN11 expression regulates growth of cells in soft agar and as xenografts.

PA624T and PA662T cells are murine melanomas cells from Cdkn2a(Ink4a/Arf) L/L; PtenL/L; Tyr-CreERT2 mice. Western analysis of PA624T with vector control or shRNAs (#4 and #9) targeting Ptpn11 (A top) and PA662T with vector control, wt, G503V, or E76K mutant PTPN11 expression (B top). Number of colonies grown in soft agar (A&B, bottom, seeded in triplicate) is shown graphically as mean +/− SD (p-value: two-tailed T-test). Subcutaneous tumor growth in nude mice implanted with PA662T cells expressing control, wt, or E76K PTPN11 over the time course (mean tumor volume +/− SEM, C). Significant difference (p<0.0001) is determined by two-way ANOVA comparing E76K with both control and wt on day 42 and comparing wt and control on day 52. Immunohistochemical (IHC) analysis of tumors for PTPN11 (flag Ab), pHistone H3 (pH3), pERK, and cleaved caspase 3 (D).
