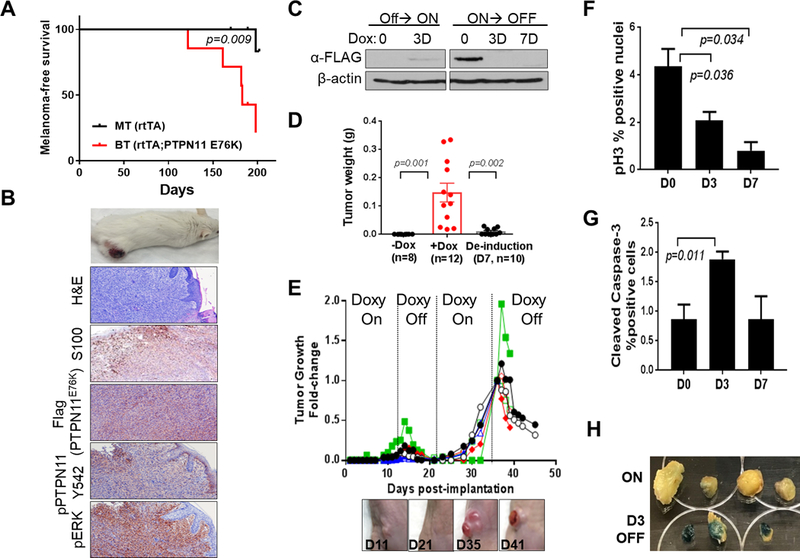
Figure 4. PTPN11 E76K is required for growth and maintenance of tumors in mice.

Kaplan-Meier melanoma free survival curves of BT (PTPN11 E76K positive) and MT (rtTA only) mice on doxy (A). Representative images of a cutaneous melanoma developed in a BT mouse, H&E, and IHC staining for S100, Flag, pPTPN11 Y542 and pERK (B). Western blot analysis of W331 cells derived from a BT melanoma (Tyr-rtTA; tetO-PTPN11 E76K;Cdkn2a(Ink4a/Arf) L/L; PtenL/L; Tyr-CreERT2) (C). Weights of W331 allograft tumors (mean tumor weight (g) +/− SEM) grown in nude mice fed with (+Dox) or without (-Dox) doxy on day 11 following implantation (p=0.001; +Dox vs. -Dox group) or deinduced for 7 days following growth on doxy for 11 days (p=0.002; De-induction vs. +Dox group) (D). Repeated cycles of doxy induction/de-induction (PTPN11 E76K expression On/Off) drive growth and regression of s.c. tumors (E). Quantification of p-Histone H3 (F) and cleaved caspase 3 (G) by IHC analysis on tumor sections following PTPN11 de-induction on D0, D3, and D7. Senescence associated β-galactosidase staining (blue) of tumors on D0 and D3 (H). p-value is calculated using two-tailed t-test for D, F, and G.
