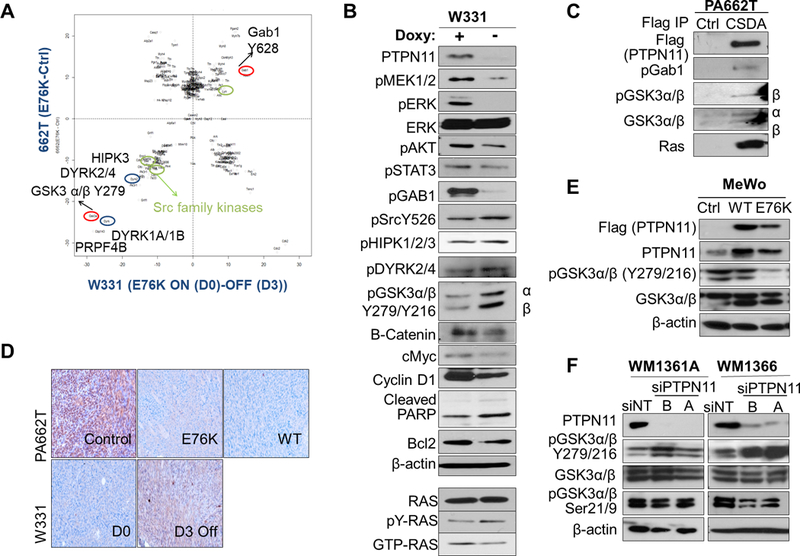
Figure 5. Phosphotyrosine proteomic analysis of PTPN11 expressing tumors identifies candidate substrates of PTPN11, including GSK3α/β.

A. Normalized scatter plot of the log2 values of the median (E76K/ctrl) ratios for individual phosphosites. Peptides changed in PA662T (Cdkn2aL/L; PtenL/L;Tyr-CreERT2) transduced with E76K vs. vector ctrl are shown along the y axis and ones altered in W331 (Tyr-rtTA;tetO-PTPN11E76K; Cdkn2aL/L; PtenL/L;Tyr-CreERT2) on doxy (D0, E76K+) vs. de-induced (D3, E76K-) are on the x axis. B. Western blot analysis of W331 cells with or without doxy with indicated antibodies. Immunoblotting with Ras antibody detected the level of total, activated (Ras-GTP pull-down), and tyr phosphorylated (pTyr pull down) Ras in W331. C. Co-immunoprecipitation using anti-FLAG beads in control or CSDA-PTPN11-Flag (trapping mutant) expressing 662T cells were immunoblotted with antibodies against pGab1, pY-GSK3, total GSK3 and Ras. D. IHC staining of pY-GSK3 in 662T control, E76K, and wt PTPN11 expressing tumors and in W331 tumors (D0 and D3). Western analysis of human melanoma cell lines MeWo (E, BRAF/NRAS wt) with PTPN11 (wt or E76K mutant) and WM1361A and 1366 (F, NRAS mutant) with PTPN11 KD (siRNAs A, B) compared to controls.
