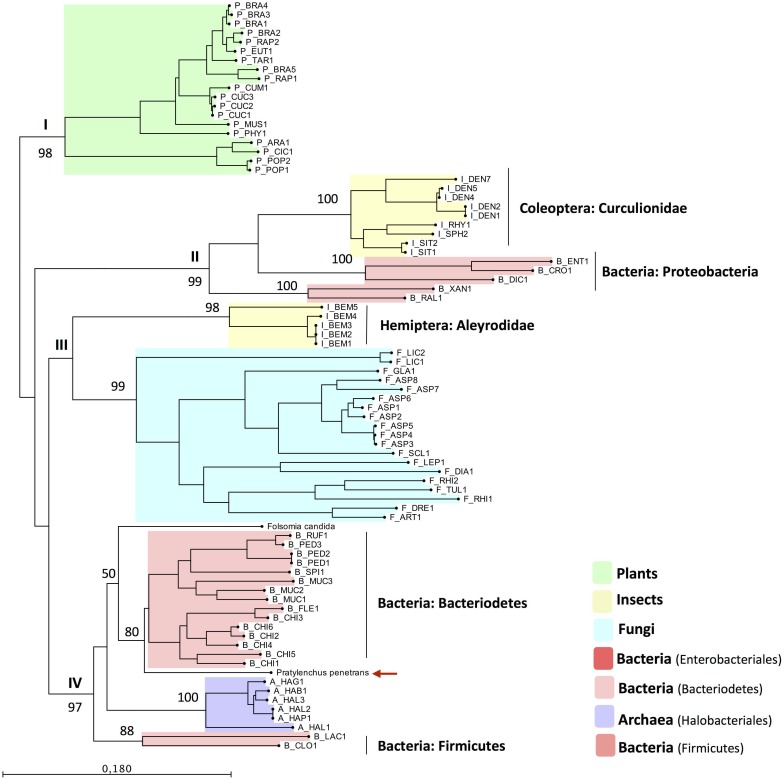
Fig 4. Phylogenetic tree based on the closest homology to the catalytic domain of Pp-PME.
The PME sequences across different taxa were chosen based on the top BLAST hits against the Pp-PME predicted pectinesterase domain. The corresponding species names and range of e-values are presented in S3 Table. The red arrow indicates the position of P. penetrans PME. The phylogenetic tree was deduced by Maximum Likelihood with the “Whelan and Goldman” (WAG) model with discrete gamma distribution and 1000 bootstrap replicates.

