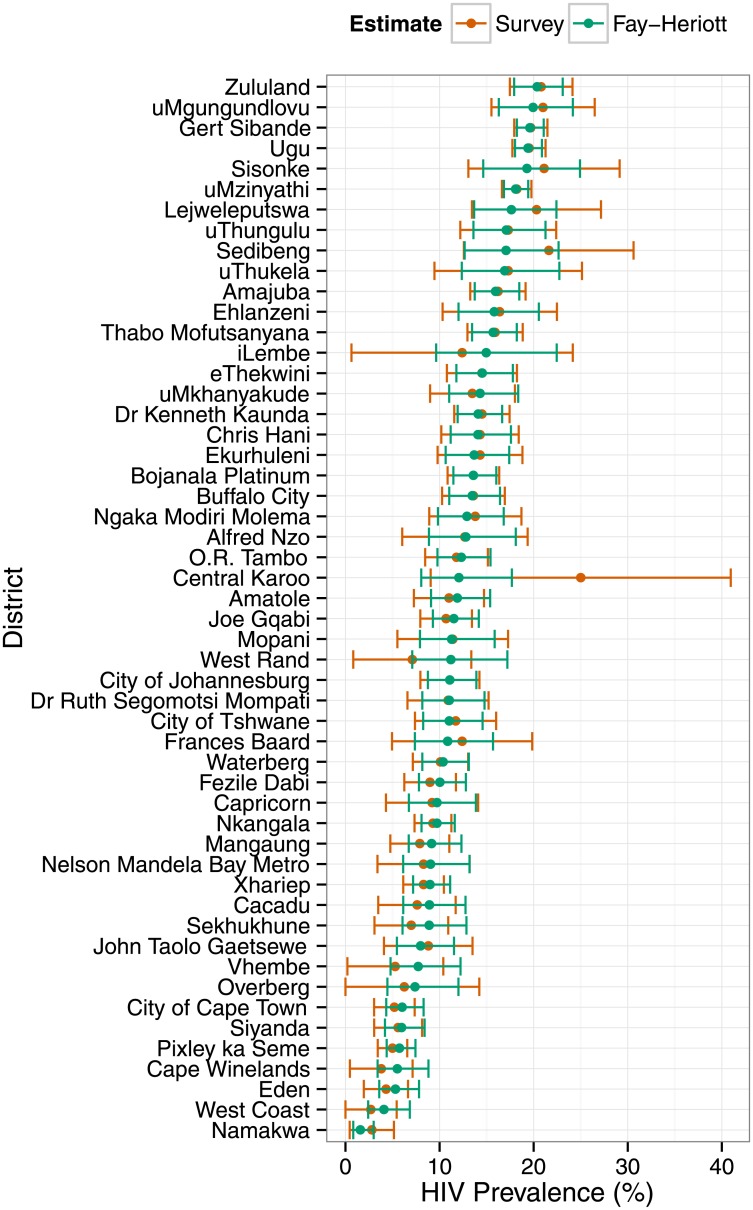
Fig 2. HIV prevalence in the districts of South Africa, 2012.
District-level estimates of HIV prevalence and 95% confidence intervals from the 2012 South African National HIV survey, and from Fay-Herriot small-area estimation. Numeric values are provided in S2 Table.

