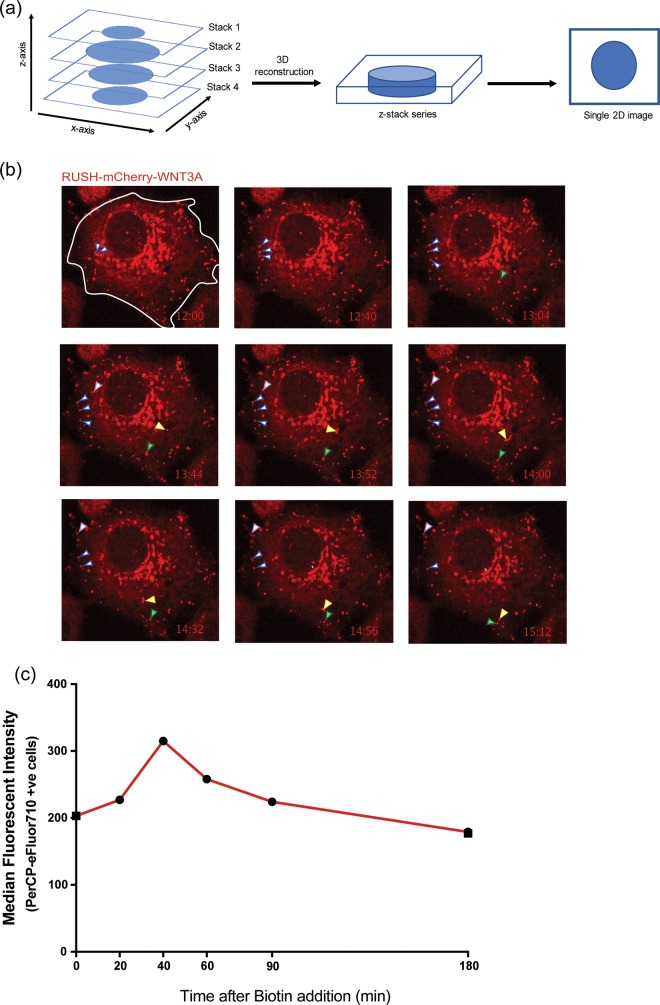
Fig 4. WNT3A time course to the membrane.
(a). Multiple focal depth z-stack imaging was used to visualize vesicles leaving the Golgi after biotin addition. Different focal planes along the z-axis in a single cell were acquired at multiple time points after Wnt release. During analysis, each z-stack series was flattened to the xy-plane to generate the 2D images and movies. (b) Wnt vesicles pause in sub-plasma membrane regions. Individual flattened z-stacks images of HeLa cells expressing RUSH-mCherry-WNT3A. 18 hrs post-transfection, 100 μM biotin was added to the cells and time course z-stack imaging was started at t = 12:00 to visualize vesicular transport to the PM. The various arrows follow individual vesicles to illustrate their pause near the plasma membrane prior to presumed membrane fusion. (c) Wnt-containing vesicles fuse with the plasma membrane. HeLa cells expressing RUSH-eGFP-WNT3A were treated with 100 μM biotin at t = 0. Cell-surface Wnt was detected at the indicated time points by flow cytometry in non-permeabilized cells stained with anti-GFP antibody tagged with PerCP-eFluor710. Median fluorescent intensities of the PerCP-eFluor710 positive cells were used to plot the graph (representative of three independent experiments).

