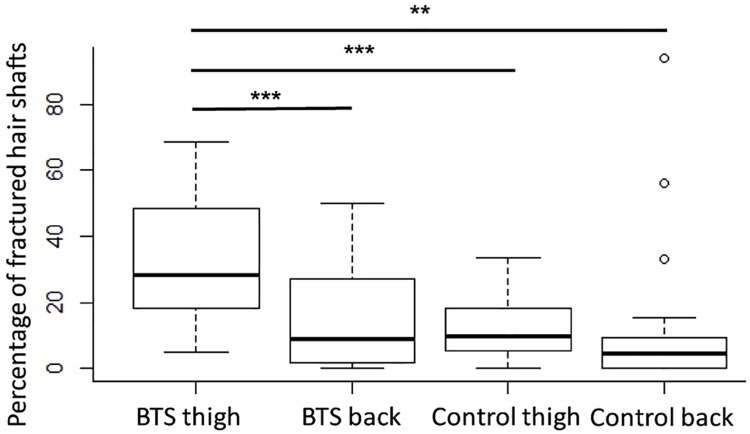
Fig 2. Boxplots illustrating the percentage of fractured hair shafts plucked from the thigh and back of affected and control dogs.
The box includes the median of the data and the box edges are the 25th and 75th percentiles. The vertical size of the boxes displays the interquartile range (IQR); the whiskers represent the minimum and maximum values that do not exceed 1.5 x IQR from the median. ** p < 0.01 *** p < 0.001.

