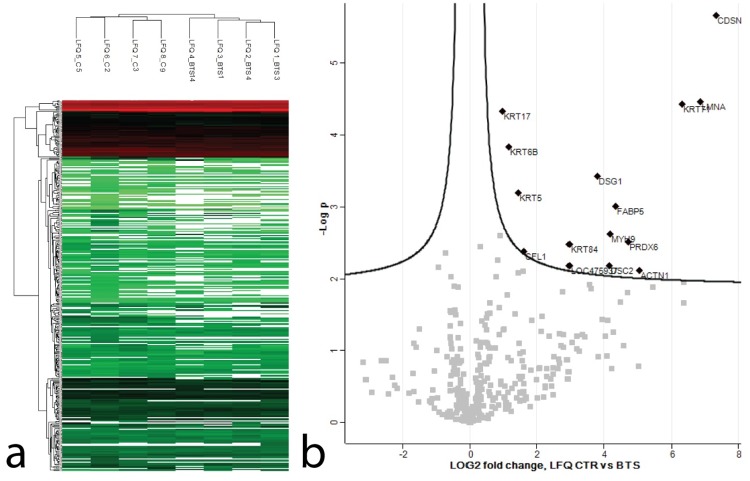
Fig 4. Canine hair proteins identified by nLC-MS/MS.
(a) Hierarchical clustering of LFQ protein intensities. Highly abundant proteins are shown in red, low abundances in green, intermediate values in different shades of red and green and missing protein values are displayed in white. BTS affected dogs and control dogs form two distinct clusters. (b) Volcano plot representing the results of the T-test performed on LFQ intensities of control vs BTS. Differentially expressed proteins with a FDR < 0.05 and a log2 fold change cut-off value of 1 are labeled.

