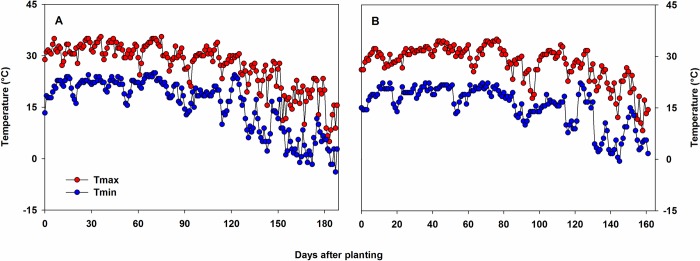
Fig 2.
Daily maximum (Tmax) and minimum (Tmin) temperatures from planting through the end of the season at Florence, SC, USA (a) and Pendleton, SC, USA (b). Temperature data were obtained from the National Centers for Environmental Information (NCEI) of National Oceanic and Atmospheric Administration (NOAA). Soybean genotypes were planted on 9 June 2017 at Florence and 8 June 2017 at Pendleton. The duration of the crop season was 188 and 161 d at Florence and Pendleton, respectively.

