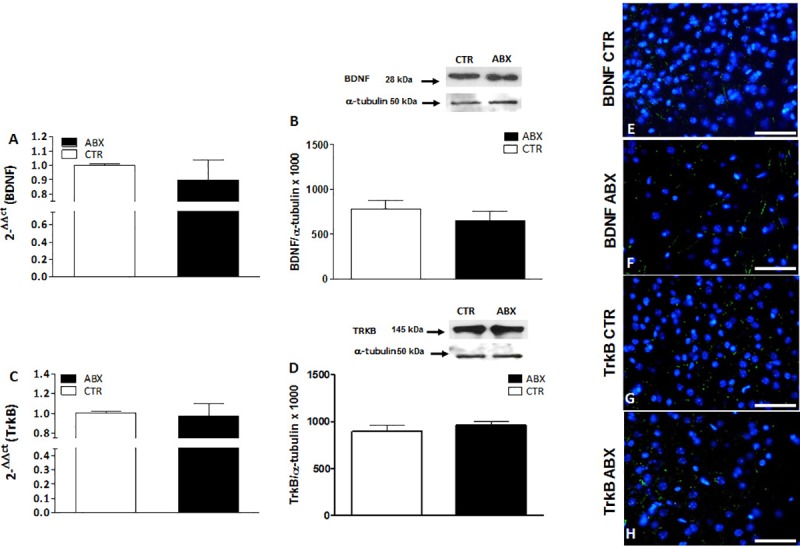
Fig 9. Expression of BDNF and TrKB in juvenile mouse prefrontal cortex (PFC) after antibiotic treatment-induced dysbiosis.

(A, C) RT-PCR quantification of BDNF (A) and TrkB (C) transcripts in the mouse PFC obtained from control (CTR, empty bars) and antibiotic treated (ABX, black bars). Values are mean±S.E.M. of 7 experiments of the percentage variation of relative gene expression with respect to values obtained in CTR animals. The relative gene expression was determined by comparing 2-ΔΔCt values normalized to β-actin. (B, D) BDNF (B) and TrkB (D) protein expression levels analyzed in the PFC obtained from CTR (empty bars) and ABX-treated animals (black bars). Blots representative of immunoreactive bands for BDNF and TrkB and α-tubulin in the different experimental conditions are reported on top of each panel. Samples (200 μg) were electrophoresed in SDS-8% polyacrylamide gels. Numbers at the margins of the blots indicate relative molecular weights of the respective protein in kDa. Values are expressed as mean±S.E.M. of 5 experiments of the ratio x1000 of the optical density (O.D.) of BDNF and TrKB vs α-tubulin in CTR and in ABX-treated preparations. (E-H) Fluorescence microscopy images showing immunostaining for BDNF (green, Panels E,F) and for TrkB (green, G,H) in the prefrontal cortex of CTR and ABX-treated mice counterstained with DAPI (blue). Bars: 50 μm.
