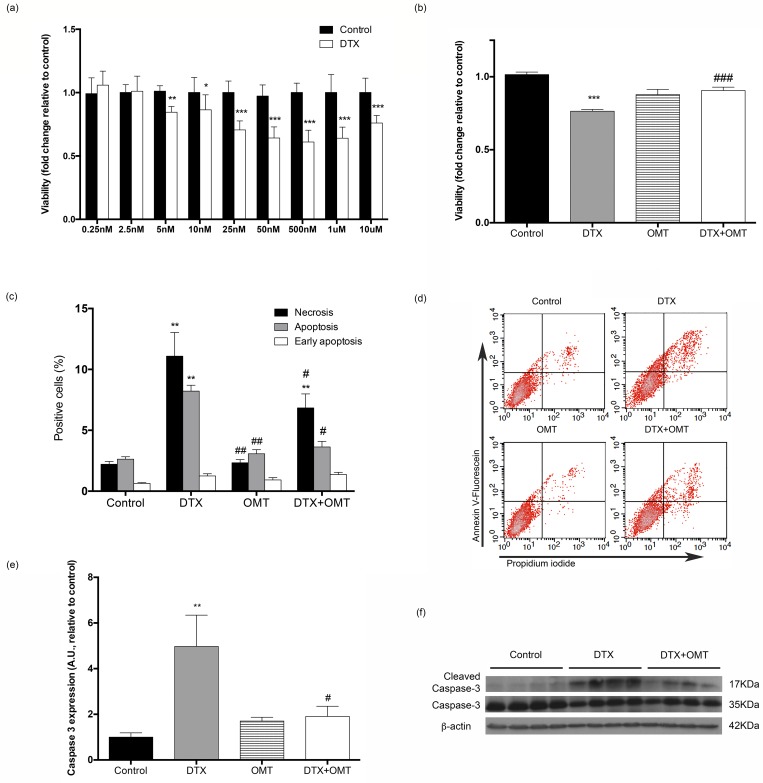
Fig 1. Effect of OMT in viability, apoptosis and Caspase 3 expression in H9c2 cells exposed to DTX.
(A) Histograms showing cell viability measured by MTT assay in H9c2 cell treated with DTX after 24 h. (B) MTT cell viability assay in H9c2 cells treated with DTX and/or OMT after 24 hours. (C) Annexin V flow cytometry assay on H9c2 cell treated with DTX and/or OMT. (D) Representative density-plots images of Annexin V-FITC/propidium iodide (PI) double staining flow cytometry. (E) Caspase-3 levels in H9c2 cells treated with DTX and/or OMT after 24 hours. (F) Representative western blot autoradiographic images. Data are expressed as mean ± SEM of three or four independent experiments. Statistical significance *, ** and ***p < 0.05, 0.01, and 0.001 vs. control; #, ##, ### p< 0.05, 0.01 and 0.001 DTX-OMT vs. DTX.

