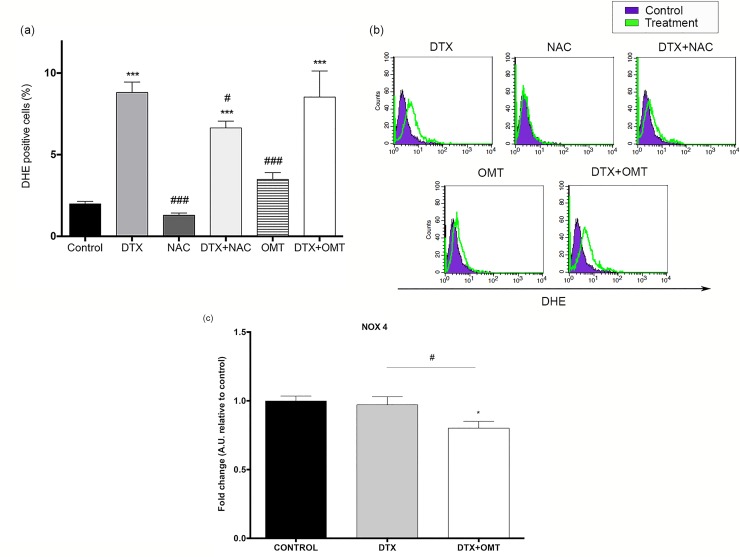
Fig 2. Effect of OMT in ROS production and NADPH oxidase (NOX4) expression in H9c2 treated with DTX.
(A) ROS levels determined by flow cytometry using DHE staining in H9c2 cells treated with DTX and/or OMT after 24 hours and/or pre-treated with NAC for 1h. (B) Representative histogram images of DHE staining. (C) Histograms showing NOX4 mRNA expression measured by real-time polymerase chain reaction in H9c2 cell treated with DTX after 24 h. Data represent the means ± SEM from at least three independent experiments. Statistical significance *, ** and ***p < 0.05, 0.01, and 0.001 vs. control; #, ##, ### p< 0.05, 0.01 and 0.001 DTX-OMT vs. DTX.

