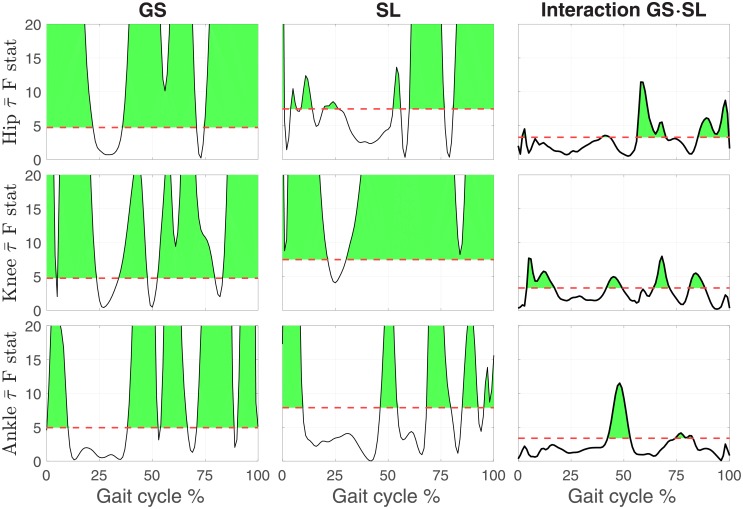
Fig 4. Main effects of gait speed (GS) and stride length (SL), and of their interaction, on the normalized joint moment profiles during normal walking, as described by the 1D time series of F-statistic extracted by the 2-way repeated measure ANOVA.
The threshold F statistic for each experimental condition is reported by the red dashed line, and values above (shaded in green) correspond to a significant group effect of the factor, at the corresponding gait cycle instant, for a corrected type I error rate α < 0.05.

