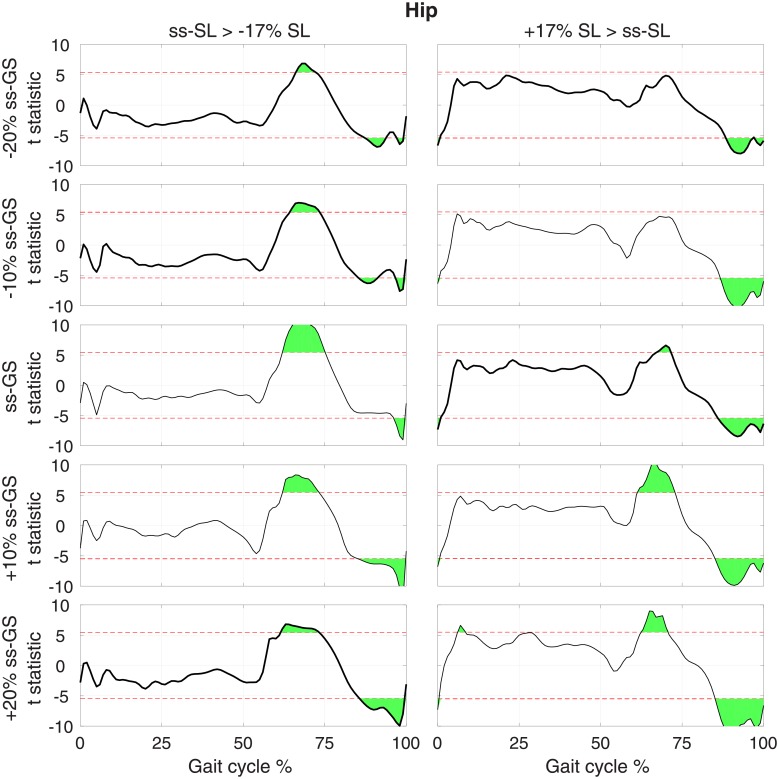
Fig 5. T-statistic resulting from pairwise comparisons of normalized hip torque moment at normal and modulated SL (columns), measured at the same GS, for each GS (row).
Red dashed lines show the threshold t value that provides a corrected type I error rate α = 0.05, extracted using a Bonferroni correction that accounts for all pairwise comparisons ncomp = 30.

