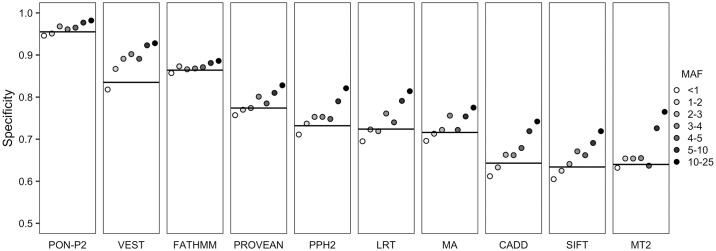
Fig 1. Performance of variant tolerance predictors.
Specificities of 10 prediction tools for variants with different AFs. The black horizontal line indicates performance for all variants (AF ≥1% and <25%). The variants with AF <1% have low AF in the whole dataset but have higher AF in at least one of the populations. MA, MutationAssessor; MT2, MutationTaster2; PPH2, PolyPhen-2.

