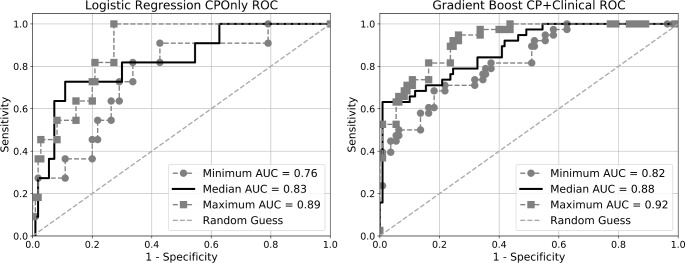
Fig 5.
Receiver operating characteristic (ROC) curves for the logistic regression model and the gradient boosting model on the CPOnly (left) and CP+Clinical dataset (right), respectively. Each figure presents three curves: the solid black curve corresponds to the iteration of the nested cross-validation procedure with the median value of area under the curve (AUC), the two dashed lines represent the iterations with the minimum and maximum AUC.

