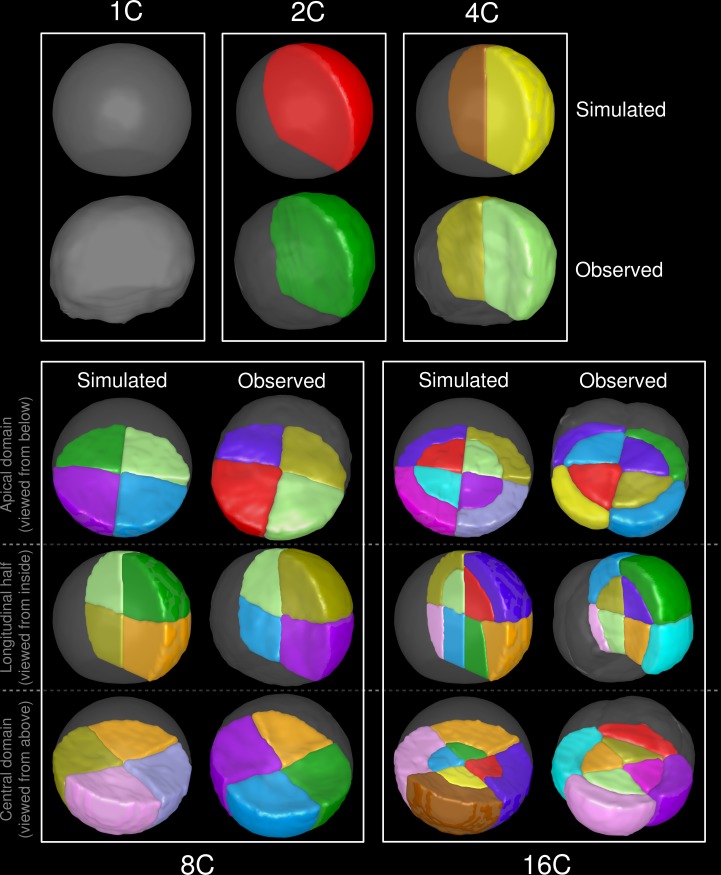
Fig 5. The geometrical rule reproduces the complete sequence of events up to the 16C stage.
Results of recursively applying the rule from an initial truncated sphere (1C, Top). The model was run 50 times at each generation, with volume-ratio ρ* set to 0.5 (1C-2C and 2C-4C transitions), 0.45 (4C-8C) and 0.33 (8C-16C). The best simulation according to the rule was selected as input for the next generation. Cellular patterns observed on real embryos from the the corresponding stages are shown for comparison.

