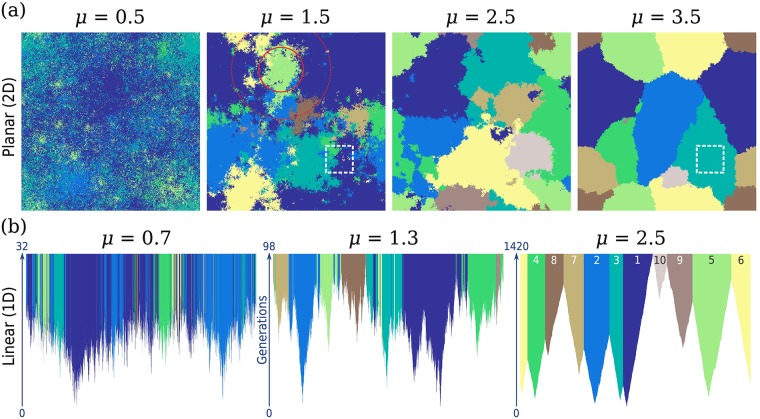
Fig 1. Spatial soft sweep patterns with the same number of distinct alleles vary strongly with jump kernel.
(a) Final states of 2D simulations on a lattice of size 512 × 512, for a range of values of the kernel exponent μ. Each pixel corresponds to a deme, and is coloured according to the identity of the allele occupying that deme; demes belonging to the same mutant clone share the same colour. Simulations were chosen to have ten unique alleles in the final state; colours reflect the temporal order of the originating mutations as labeled in the lower right panel. Rescaled mutation rates are 3 × 10⁻⁶, 10−6, 10−6, and 10−7 for kernel exponents 0.5, 1.5, 2.5, and 3.5 respectively. The solid and dotted circles in the second panel indicate the extent of the core and the halo respectively for the light green clone, as quantified by the measures req and rmax respectively (see text for definitions). The subrange highlighted by a dashed box contains six distinct alleles for μ = 1.5 but only one allele for μ = 3.5. (b) Full time-evolution of 1D simulations with L = 16384 for three kernel exponents, chosen so that the final state has ten unique alleles. Each vertical slice displays the lattice state at a particular time (measured in generations), starting from an empty lattice (white) and continuing until all sites are filled and the sweep is completed. The rescaled mutation rates are 3 × 10⁻⁵, 7 × 10⁻⁶, and 7 × 10⁻⁷ respectively from left to right. In the last panel, the colours are labelled according to the order of appearance of the originating mutation; the same order is shared among all panels in the figure.

