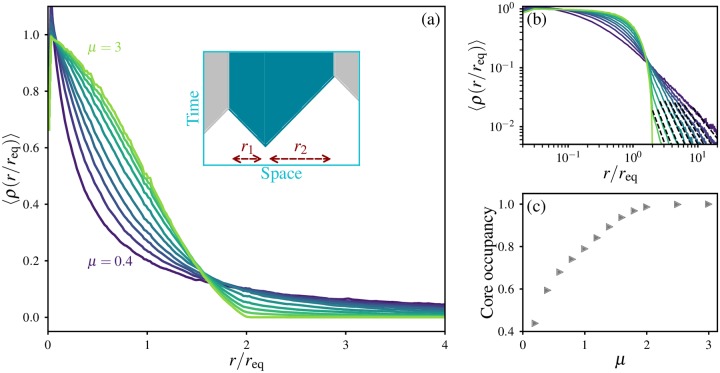
Fig 3. Occupancy profiles of clones show the reduced prominence of the core with increased long-range dispersal.
(a) Ensemble-averaged occupancy profiles of mutant clones in 1D, with L = 106 and . The occupancy profile of a particular clone is defined as the probability ρ(r) that a deme at distance r from its point of origin is occupied by that clone. Colours signify different dispersal kernels, with exponents μ = {0.4, 0.6, 0.8, 1, 1.2, 1.4, 1.6, 1.8, 2, 3} in order of increasing occupancy at the origin. Curves are obtained by averaging individual occupancy profiles from all clones with total mass X > 100 to obtain a range-averaged occupancy profile 〈ρ〉 for each of 100 independent simulations for each dispersal kernel; these were then averaged to obtain the ensemble-averaged profile . Inset illustrates the origin of the variation in occupancy for r/req < 2 in the wavelike growth regime: the mutational origin need not be positioned at the centre of mass of the contiguous domain, giving rise to a single-clone occupancy profile ρ(r) = {1, 0 < r ≤ r1; 1/2, r1 < r ≤ r2; 0, r > r2}. (b) Same data as in (a) on logarithmic scales. The dashed lines show the power-law dependence 〈ρ〉 ∝ r−(μ+d). (c) Core occupancy, defined as the fraction of the ensemble-averaged occupancy that lies within 0 < r/req < 2, as a function of kernel exponent μ.

