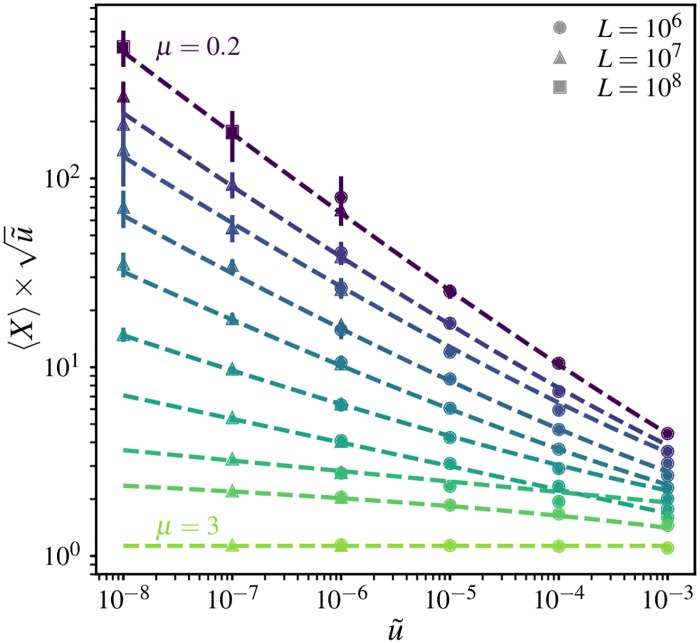
Fig 4. Average clone mass is set by mutation-expansion balance.
The ensemble-averaged final mass of mutant clones 〈X〉 as measured from 1D simulations as a function of rescaled mutation rate, scaled by the expected dependence () for wavelike growth of clones. Results from different system sizes (symbols) are presented for each dispersal kernel quantified by μ (colours); the values are (from top to bottom) μ = {0.2, 0.6, 0.8, 1, 1.2, 1.4, 1.6, 1.8, 2, 3}. Each point represents an average over 20 or more independent simulations. Error bars denote measured standard deviation across repetitions. Dashed lines show the theoretical predictions for for each dispersal kernel (see S1 Appendix, Section A for details), multiplied by a μ-dependent magnitude factor whose value is 1.5 for 1 ≤ μ < 2, 1.6 for μ > 2, and 1.65 for all other values.

