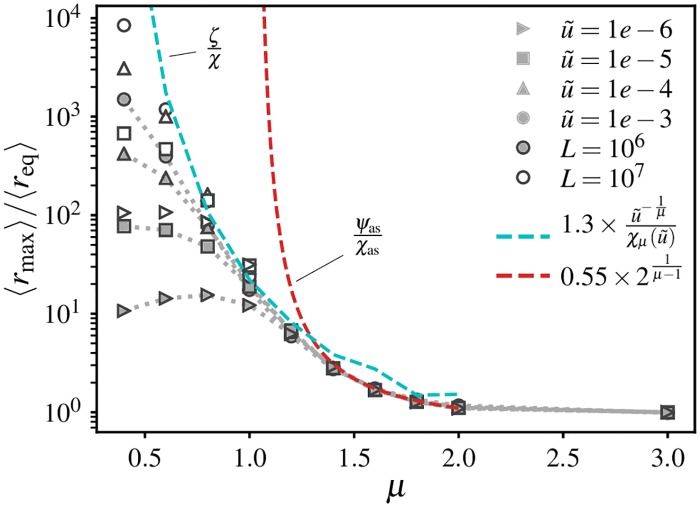
Fig 5. The spatial extent of clones can be much larger than the expectation derived from the average mass.
Ensemble-averaged spatial extent of clones 〈rmax〉, where rmax is defined as half the distance between leftmost and rightmost demes belonging to a particular clone. Values are normalized by the ensemble-averaged mass-equivalent radius 〈req〉 in 1D simulations. Each point is an average over values from 20 independent simulations. Dotted lines connect simulation data points. Dashed lines show the theoretical expectations ζ/χ (with ) and ψas/χas in the ranges μ < 1 and 1 < μ < 2 respectively, multiplied by model-dependent numerical factors. For μ < 1, is evaluated as described in S1 Appendix, Section A; for 1 < μ < 2, the ratio ψas/χas is independent of . The fall in the measured ratio at low values of for μ < 1 is due to finite-size effects, as seen by comparing the two system sizes: the measured values of rmax in this range are below the values that would be measured in an infinitely large system.

