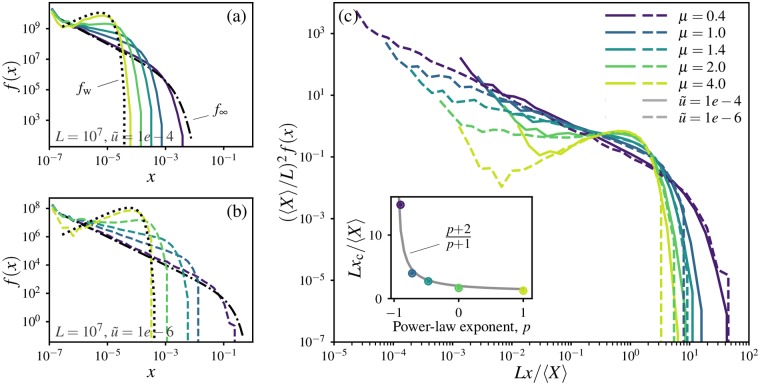
Fig 6. Variation of allele frequency spectra with mutation rate and dispersal kernel.
(a) Allele frequency spectra f(x) estimated from 1D simulations with L = 107 and . Each curve is the average of frequencies measured from 20 independent simulations. Curves are coloured by dispersal kernel according to the legend in (c). The uptick for the lowest bin is an artifact of the logarithmic bin sizes together with the hard lower cutoff in allele frequency at x = 1/L. Black dotted and dash-dotted lines show the analytical distributions for wavelike spreading and panmictic limits respectively. (b) Same as in (a) except with . (c) Frequency spectra from (a) and (b), rescaled to remove the expected variation due to changes in average clone size. Inset, dependence of the cut-off frequency xc on the exponent p when frequency spectra are approximated by a power law f(x) ∝ xp for x ≤ xc and f(x) = 0 for x > xc. Dots show the cutoff estimated numerically as the value for which the second derivative of the rescaled curves first drops below −4, plotted against the observed exponents p ≈ {−0.9, −0.72, −0.47, 0, 1} for the small-frequency behaviour.

