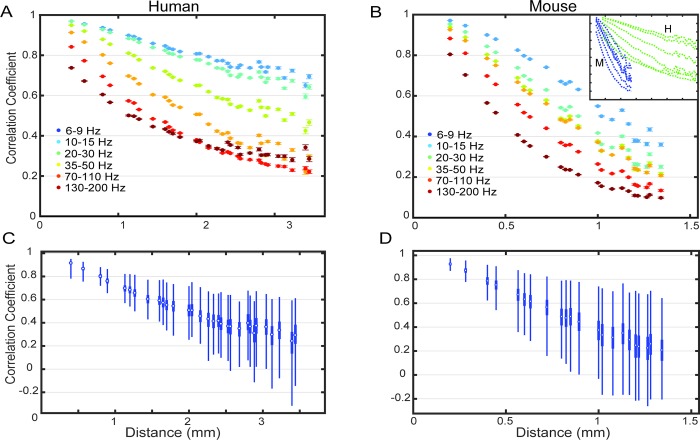
Fig 1.
Correlation averaged equidistant electrode pairs (DAC) (A) Results for a human subject 1. Each color represents a frequency band. Error bars are 95% confidence interval of the mean across all time windows and equidistant electrode pairs. (B) DAC for mouse 1. Inset shows (A) and (B) plotted on the same scale for comparison between human (green) and mouse (blue) DAC. (C-D) The distribution across time obtained by averaging only within each window. Boxplot of the distributions of the correlation values over time for one human and one mouse subject in the 35–50 Hz band. The distributions are across all 2.0 s windows with each value the average at each distance of the correlation.

