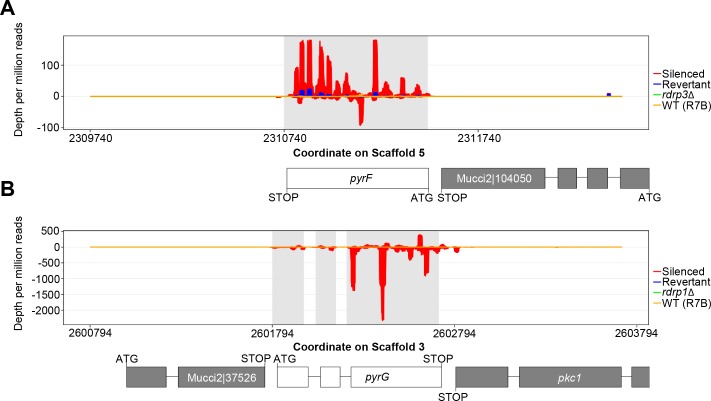
Fig 2. 5-FOA resistance is associated with increased levels of sRNAs against either the pyrF or pyrG locus.
(A) Representative diagram of sRNAs mapped across the pyrF locus showing accumulation of both sense (- values) and antisense sRNA (+ values) in epimutant E1 (in red). Expression levels are greatly decreased in the revertant after 5 passages without selection (in blue). No increase in sRNA levels is seen in the surrounding regions. (B) Representative diagram of sRNAs mapped across the pyrG locus showing accumulation of both sense (+ values) and antisense sRNA (- values) in epimutant E4 (in red), with greatly decreased sRNA levels in the revertant after 5 passages without selection (in blue). No increase of sRNA levels is observed in the surrounding regions.

