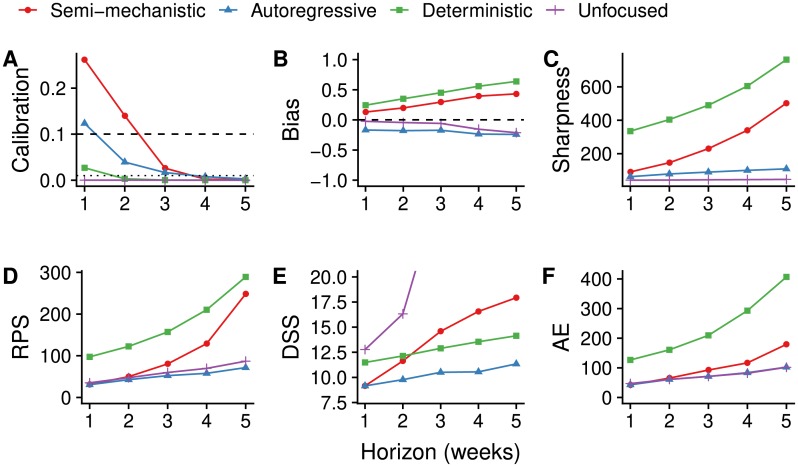
Fig 3. Forecasting metrics and scores of the best semi-mechanistic model variant compared to null models.
Metrics shown are (A) calibration (p-value of Anderson-Darling test, greater values indicating better calibration, dashed lines at 0.1 and 0.01), (B) bias (less bias if closer to 0), (C) sharpness (MAD, sharper models having values closer to 0), (D) RPS (better values closer to 0), (E) DSS (better values closer to 0) and (F) AE (better values closer to 0), all as a function of the forecast horizon.

